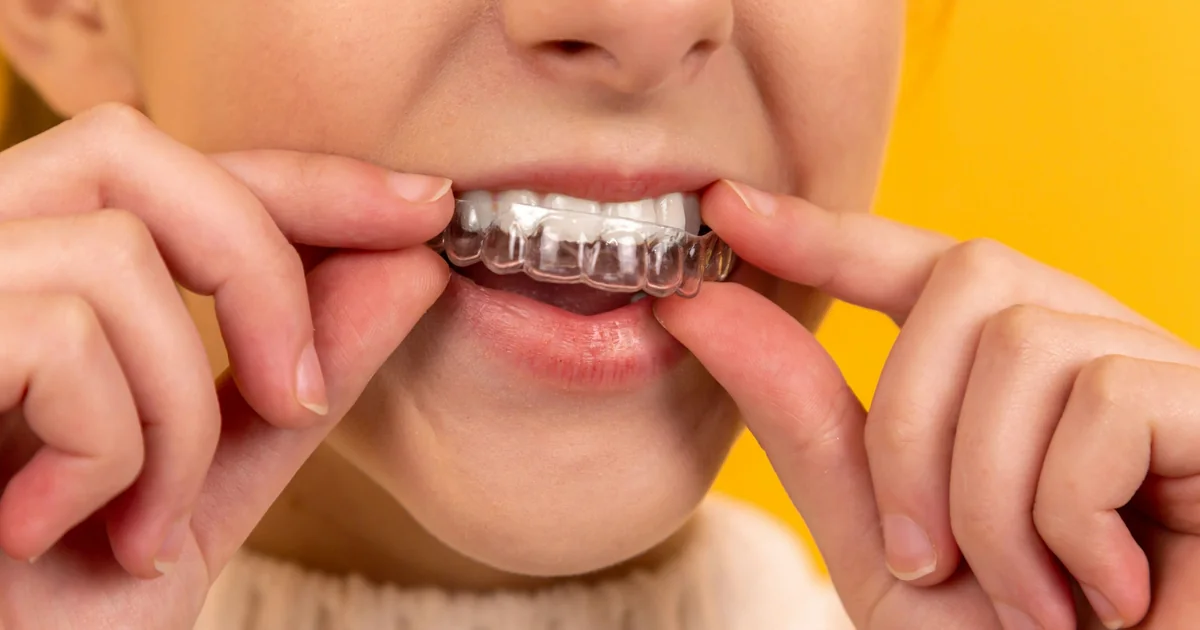
Dental Practice Customer Communication Statistics 2026
40+ sourced statistics on dental patient communication, no-shows, new patient acquisition costs, and patient expectations.
Last updated: 2026-05-03
TL;DR: This roundup compiles 40+ sourced statistics on how dental patients communicate with practices, what they expect, and where practices fall short. From missed call rates to no-show costs, from patient texting preferences to technology adoption — use these numbers to benchmark your practice and make data-driven decisions about patient communication technology.
Dental Practice Customer Communication Statistics 2026
Data-driven dental practices outperform their peers. Yet most practice owners rely on gut feeling when making decisions about patient communication technology, staffing, and marketing. This comprehensive statistics roundup gives you the numbers you need to benchmark your practice against industry standards and identify the highest-impact improvements.
We've gathered 40+ statistics from industry sources including the American Dental Association, dental technology companies, healthcare research firms, and peer-reviewed studies. Each statistic is sourced, and we update this page regularly as new data becomes available.
Patient Communication Preferences
Understanding how patients want to communicate is the foundation of any effective patient engagement strategy. The data reveals a clear shift toward digital, text-based communication across all age groups.
1. 55% of patients prefer text messaging over phone calls
Approximately 55% of patients across all age groups prefer text messaging as a communication channel over phone calls for appointment reminders, confirmations, and general practice communication (Source: RevenueWell; industry estimate, not independently verified).
2. Text messages have a 98-99% open rate versus 20% for email
Text messages achieve a 98-99% open rate, while emails are only opened about 20% of the time. For time-sensitive communications like appointment reminders and confirmations, texting is nearly 5x more effective at being seen (Source: RevenueWell / Dental Intel; industry estimate, not independently verified).
3. 85% of text messages are read within 5 minutes
Patients read 85% of text messages within 5 minutes of receiving them, compared to hours or days for email. This makes texting the most effective channel for same-day appointment reminders and urgent communications (Source: RevenueWell; industry estimate, not independently verified).
4. 78% of patients say texting is the fastest way to reach them
A survey by Text Magic found that 78% of people said text messaging was the fastest way to reach them for important updates, including healthcare appointments and reminders (Source: Text Magic / ProSites; industry estimate, not independently verified).
5. 69% of patients appreciate texts or emails from healthcare providers
Research shows that 69% of consumers appreciate getting texts or emails from healthcare providers. Far from being intrusive, patients actively welcome digital communication from their dental practice (Source: Dental Intel; industry estimate, not independently verified).
6. 77-96% of patients report higher satisfaction with text-based communication
Studies show that 77% to 96% of patients are more satisfied when dental clinics use text messaging for reminders, follow-ups, and general communication versus phone-only approaches (Source: RevenueWell / Rectangle Health; industry estimate, not independently verified).
7. Americans send 5x more texts than phone calls
American smartphone users send and receive five times more texts than they make and receive phone calls. Patient communication strategies built primarily around phone calls are misaligned with how people actually communicate today (Source: RevenueWell; industry estimate, not independently verified).
8. Texting is the No. 1 communication method for patients under 50
Texting is the No. 1 most used form of communication among Americans younger than 50, making it critical for practices looking to attract and retain younger demographics including millennials and Gen Z (Source: RevenueWell / DrBicuspid; industry estimate, not independently verified).
9. 40% of dental inquiries come outside business hours
Approximately 40% of patient inquiries — including appointment requests, questions about services, and emergency calls — occur outside standard 9-5 business hours. Practices without after-hours response lose these inquiries to competitors (Source: TrueLark; industry estimate, not independently verified).
10. Patients contact 2-3 practices before booking
New dental patients typically contact 2-3 practices before making a booking decision. The practice that responds first has a dramatic advantage in conversion rates, with 64% of patients booking within the first 10 minutes of contact (Source: DCM Moguls; industry estimate, not independently verified).
Key Takeaway
The message is clear: patients want to text, not call. Dental practices that rely exclusively on phone communication are misaligned with patient preferences and losing patients to practices that offer multi-channel communication. Consider adding AI-powered chat and messaging to meet patients where they already are.
Appointment No-Show Statistics
No-shows are one of the most expensive and frustrating problems dental practices face. The data shows both the scale of the problem and what works to fix it.
11. The average dental no-show rate is 15%
The average no-show rate for dentistry in the United States is approximately 15%, though individual practices may see rates from 5% to 30% depending on patient demographics, practice efficiency, and reminder systems in place (Source: Arini / Maxillo Dental; industry estimate, not independently verified).
12. Dental no-shows cost practices $105,000+ annually
Dental practices across the country lose an average of $105,000 or more annually due to missed appointments, with the cost varying based on practice size, fee schedules, and no-show rates (Source: Arini; industry estimate, not independently verified).
13. Each missed appointment costs $200-$400 in lost production
Each no-show represents $200-$400 in lost production. For practices averaging $450-$650 per hour in production, this represents not just lost revenue but wasted chair time, staff time, and overhead costs that continue regardless of patient volume (Source: Dental Economics / Arini).
14. Forgetfulness causes 36% of dental no-shows
The primary cause of dental no-shows is simple forgetfulness, accounting for 36% of missed appointments. This is significant because it's the most easily solvable cause — automated reminders directly address this issue (Source: Inshalytics / Dialog Health; industry estimate, not independently verified).
15. Automated reminders reduce no-shows by 23-38%
Research shows that automated reminder systems reduce no-show rates by 22.95% compared to manual methods. A study by Imperial College London found SMS text reminders reduced no-show rates by 38%, making automated reminders one of the highest-ROI investments a practice can make (Source: PMC / Dialog Health; industry estimate, not independently verified).
16. SMS reminders achieve no-show rates as low as 1.9%
A study published in The Angle Orthodontist found that SMS text messaging achieved the lowest no-show rate of 1.90% — dramatically lower than phone call reminders or email reminders. The 98% open rate of SMS makes it the most effective reminder channel (Source: PMC / The Angle Orthodontist; industry estimate, not independently verified).
17. Dental practices achieve 80%+ confirmation rates
While medical specialties typically achieve appointment confirmation rates of approximately 60%, dental practices using multi-channel reminder systems often exceed 80% confirmation rates. This higher rate reflects both patient engagement and the effectiveness of modern reminder systems (Source: Dialog Health; industry estimate, not independently verified).
18. Two-way confirmation texts reduce no-shows further
Practices that use two-way confirmation — where patients can reply "C" to confirm or "R" to reschedule — see additional reductions in no-shows beyond standard one-way reminders. The ability to easily reschedule rather than simply not showing up gives patients a friction-free alternative (Source: Rectangle Health / Dental Intel; industry estimate, not independently verified).
19. Multi-touch reminders outperform single reminders
The optimal reminder sequence is a 48-hour advance reminder, a 24-hour reminder, and a same-day 2-hour reminder. Practices using this three-touch approach see significantly lower no-show rates than those sending a single reminder (Source: Dialog Health / Inshalytics; industry estimate, not independently verified).
20. No-show rates spike on Mondays and after holidays
No-show patterns follow predictable patterns, with the highest rates occurring on Mondays, the day after holidays, and during weather events. Practices can proactively overbook or intensify reminders on these high-risk days (Source: Dentistry Dashboard; industry estimate, not independently verified).
Reducing No-Shows at Your Practice
Want a step-by-step guide to reducing no-shows? Read our comprehensive guide: How to Reduce No-Shows at Your Dental Practice with Automated Reminders.
New Patient Acquisition and Marketing Statistics
Understanding the economics of patient acquisition helps practices make smart investments in marketing and communication technology.
21. New patient acquisition costs $150-$300 for general dentistry
The average cost to acquire a new general dentistry patient falls between $150 and $300 through marketing channels. If you're acquiring patients for under $100, your marketing is performing exceptionally well; if you're paying over $350 for a general cleaning patient, it's time to audit your marketing strategy (Source: Dentplicity / Zevi Digital; industry estimate, not independently verified).
22. Specialty patient acquisition costs $300-$600+
For high-value services like dental implants or orthodontics, the industry average acquisition cost ranges from $300 to $600+ per patient. However, spending $500 to acquire an orthodontic case worth $6,000 represents a 12x return (Source: Incept Health / Dentplicity; industry estimate, not independently verified).
23. Patient lifetime value ranges from $7,000 to $10,000
The typical lifetime value of a new dental patient ranges between $7,000 and $10,000, accounting for biannual cleanings, X-rays, and basic restorative work over 7-10 years. With restorative, cosmetic, and emergency treatments included, lifetime values can reach $15,000-$22,000 (Source: Darkhorse Tech / Wonderful Dental; industry estimate, not independently verified).
24. New patients spend $700-$1,250 in their first year
The typical new patient spends an average of $700-$1,250 in their first year at a practice, including initial exam, X-rays, cleaning, and any immediate treatment needs. First-year revenue typically represents 10-15% of total lifetime value (Source: Overjet / Digital Resource; industry estimate, not independently verified).
25. Dental practices spend 4-7% of revenue on marketing
Industry benchmarks recommend dental practices spend between 4-7% of annual revenue on marketing. Most independent surveys find practices hovering around 4%, while marketing specialists recommend closer to 7% for practices serious about growth (Source: Vizisites / Firegang; industry estimate, not independently verified).
26. 65% of missed calls are from potential new patients
Research shows that 65% of missed calls at dental practices come from potential new patients seeking dental services — making missed calls disproportionately expensive compared to existing patient calls that can be returned more easily (Source: Resonate / Peerlogic; industry estimate, not independently verified).
27. Practices miss an average of 300 calls monthly
The average dental practice misses approximately 300 calls per month, which works out to roughly 10 missed calls per day. This includes both business-hours misses (during procedures, lunch, peak times) and after-hours calls (Source: Resonate / Peerlogic; industry estimate, not independently verified).
28. Call conversion rate: 50-53% average, 75-85% for top performers
Average dental offices convert approximately 50-53% of their answered new patient calls into booked appointments. Top-performing practices with trained staff and efficient booking processes achieve 75-85% conversion rates (Source: Gargle / Peerlogic; industry estimate, not independently verified).
Dental Technology Adoption Statistics
How quickly is the dental industry adopting communication technology, AI, and digital tools?
29. 18% of US dental professionals use AI, 66% considering it
As of 2024, 18% of US dental professionals are already integrating AI into their workflows, with another 66% considering adoption. This represents a doubling from 9% in 2023, signaling rapid acceleration in AI adoption across the dental industry (Source: Institute of Digital Dentistry / Inside Dental Technology).
30. 91% of dental practices use digital patient records
According to ADA surveys, 91% of dental practices in the US now use digital patient records. However, digital records alone don't improve patient communication — the next frontier is connecting these records to automated patient engagement systems (Source: ADA).
31. 1 in 5 dental patients has used virtual consultation
In 2024, the ADA reported that 1 in 5 dental patients had used some form of virtual consultation or teledentistry service. By 2026, teledentistry adoption is expected to continue growing, especially for initial consultations and follow-ups (Source: ADA / Evident Digital; industry estimate, not independently verified).
32. Digital dentistry market projected to reach $15.2 billion by 2034
The global digital dentistry market is projected to grow from $6.14 billion in 2024 to $15.22 billion by 2034, expanding at a CAGR of 9.5%. This includes practice management software, patient communication platforms, and clinical technology (Source: Market.us; industry estimate, not independently verified).
33. Dental practice management software market growing at 10.7% CAGR
The global dental practice management software market is expected to reach $6.9 billion by 2034, growing from $2.5 billion in 2024 at a 10.7% CAGR. This growth is driven by increasing demand for integrated patient management and communication capabilities (Source: Market Research Future).
34. 57% of dental practices use digital impression systems
From 2023 to 2024, the percentage of dental practices using digital impression systems surged from 48% to 57%. This willingness to adopt clinical technology hasn't yet translated equally to patient communication technology, representing an opportunity for forward-thinking practices (Source: Institute of Digital Dentistry).
35. 15% of US dental practices have 3D printers
As of 2024, 15% of US dental practices now use a 3D printer, up from under 10% in 2022. Technology adoption in dentistry is accelerating across the board — practices that fall behind in communication technology risk looking outdated to tech-savvy patients (Source: Inside Dental Technology).
36. Over 200,000 active dentists in 202,485 practices compete for patients
As of 2024, there are 202,485 dentists working in dentistry in the United States, with approximately 130,000 dental practices. Competition for patients is intense, especially in urban and suburban areas where 10-20 practices may be within a 5-mile radius (Source: ADA Health Policy Institute).
The Technology Gap
While 91% of dental practices have digital records and 57% use digital impressions, adoption of AI-powered patient communication tools is still in early stages. This represents a competitive advantage for practices that adopt early. Learn more about AI chatbots for dental clinics.
Response Time and Conversion Statistics
How quickly your practice responds to inquiries directly impacts whether you win or lose the patient.
37. 17% of patients book within the first minute
Data shows that 17% of dental patients book within the first minute of contact, 55% within 5 minutes, and 64% within the first 10 minutes. Very few patients book after 10 minutes, meaning delayed follow-ups drastically reduce conversion rates (Source: DCM Moguls; industry estimate, not independently verified).
38. Average dental practice response time: 2 hours 5 minutes
The average dental practice takes 2 hours and 5 minutes to respond to patient inquiries, despite the healthcare benchmark for ideal response time being under 10 minutes. Practices that achieve the 5-minute standard consistently outperform competition in patient acquisition (Source: DCM Moguls; industry estimate, not independently verified).
39. Practices responding in under 5 minutes convert at dramatically higher rates
Research from Harvard Business Review shows that leads contacted within 5 minutes are 100x more likely to convert than those contacted after 30 minutes. For dental practices, every minute of delay reduces the probability of booking by a measurable percentage (Source: Harvard Business Review / InsideSales.com).
40. 35% of dental calls go unanswered
Research shows that dental practices miss an average of 35% of incoming calls, with some practices experiencing rates as high as 68% during peak hours. Even during business hours, the combination of procedures, lunch breaks, and multi-tasking front desk staff means a significant portion of calls are missed (Source: Reach / Resonate; industry estimate, not independently verified).
41. Each missed new patient call costs $7,000-$10,000 in lifetime value
When combining the 65% new-patient probability of missed calls with average lifetime values, each missed call represents an expected value loss of approximately $4,500-$6,500. Over a year, with 300 missed calls monthly, the potential lifetime revenue loss is staggering (Source: Resonate / Darkhorse Tech; industry estimate, not independently verified).
42. Practices with instant response capture 2-3x more after-hours patients
Dental practices that implement 24/7 automated response systems capture 2-3 times more after-hours patient inquiries compared to practices relying solely on voicemail or next-day callbacks (Source: TrueLark; industry estimate, not independently verified).
Benchmarks: How Does Your Practice Compare?
Use this table to benchmark your practice against industry averages and top performers:
| Metric | Below Average | Industry Average | Top Performers |
|---|---|---|---|
| Missed call rate | 40%+ | 35% | Under 10% |
| Response time | 4+ hours | 2 hours | Under 5 minutes |
| No-show rate | 20%+ | 15% | Under 5% |
| New patient call conversion | Under 40% | 50-53% | 75-85% |
| Patient acquisition cost | $350+ | $150-$300 | Under $100 |
| Marketing spend (% of revenue) | Under 2% | 4-5% | 5-7% |
| After-hours response | Voicemail only | Answering service | AI-powered instant response |
| Reminder channels | Phone only | Phone + email | SMS + email + multi-touch |
| Patient retention | Under 70% | 75-80% | 90%+ |
| Digital communication | None | Basic email | Text + chat + social |
Where to Start
Focus on the metrics where you fall below average — these represent your biggest opportunities for improvement. Most practices see the fastest ROI from improving missed call rates and implementing automated reminders. Both are achievable with modern patient communication platforms.
Frequently Asked Questions
Where do these dental communication statistics come from?
The statistics in this roundup come from a mix of industry sources: the American Dental Association (ADA) for workforce and adoption data, dental technology companies like Resonate, Peerlogic, and TrueLark for call handling metrics, peer-reviewed studies in journals like The Angle Orthodontist for reminder effectiveness, and market research firms for industry sizing. Each statistic includes a source attribution. We update this page periodically as new data becomes available.
What is the most important statistic for dental practice owners?
The missed call rate (35% average) combined with the fact that 65% of missed calls are from new patients is arguably the most actionable insight. It directly quantifies revenue you're losing today and points to a clear solution: improve your response rate. Even a 10-percentage-point improvement in your answer rate could mean dozens of additional new patients per year.
How often do dental communication statistics change?
Major trends like the shift to text-based communication and the adoption of AI are moving directionally and accelerating. Year-over-year changes in specific metrics (like AI adoption jumping from 9% to 18% in one year) can be dramatic. We recommend benchmarking your practice against these statistics at least annually and adjusting your communication strategy accordingly.
How can I find my practice's specific missed call rate?
Most modern phone systems and VoIP providers include call analytics that track answered versus missed calls. If your phone system doesn't offer this, services like Peerlogic, CallRail, or your practice management system's phone integration can provide detailed call tracking. Start by tracking for 30 days to establish a baseline.
What's the relationship between response time and patient lifetime value?
Faster response times lead to higher conversion rates, which means more new patients. But the impact goes beyond initial conversion — patients who have a positive first interaction (including fast response) show higher treatment acceptance, lower no-show rates, better retention, and more referrals. The compound effect of a 5-minute response time versus a 2-hour response time is measured in millions of dollars over a decade for a typical practice.
Are these statistics relevant for specialty dental practices?
Yes, with some variations. Specialty practices (orthodontics, periodontics, oral surgery) typically have higher patient lifetime values ($10,000-$50,000+), making each missed call even more expensive. No-show rates and communication preferences are similar across specialties. The one significant difference is patient acquisition cost, which tends to be higher for specialty practices ($300-$600+) due to more competitive marketing landscapes.
Using These Statistics to Improve Your Practice
The data in this roundup paints a clear picture: dental practices that embrace modern, multi-channel patient communication dramatically outperform those that rely on traditional phone-only approaches. The gap between average and top-performing practices isn't clinical skill—it's communication responsiveness and technology adoption.
The highest-impact changes based on these statistics are:
- Reduce your missed call rate from 35% to under 10% through automated response technology
- Implement multi-touch automated reminders to cut your no-show rate from 15% to under 5% — delivered via text (through your PMS or a dedicated reminder platform), email, and messaging channels your patients use
- Add after-hours response capability to capture the 40% of inquiries that come outside business hours
- Measure and benchmark your metrics quarterly against the industry averages in this article
Every statistic in this roundup represents either an opportunity you're capturing or revenue you're leaving on the table. The practices that win in 2026 and beyond will be the ones that let data — not habit — drive their communication strategy. For more insights on dental AI capabilities, read our guide on AI chatbot statistics for 2026.
Can the chatbot diagnose or assess dental issues?
No — and it should not. Hyperleap is configured to capture symptom information and route to your clinical team. It does not make clinical assessments or provide medical advice. This scope discipline is what keeps the deployment compliant and trustworthy.
How does emergency routing work?
The bot detects emergency keywords (knocked-out tooth, severe pain, swelling, bleeding) and routes immediately to your designated emergency contact — phone number, on-call dentist, or after-hours line — rather than scheduling a regular appointment.
Is the chatbot HIPAA-compliant for patient information?
For HIPAA-covered workflows (PHI handling, EHR integration), pair the chatbot with your existing HIPAA-compliant systems and configure scope to capture identifiers only when needed. Hyperleap routes — it does not store full medical records. Work with your compliance team for your specific configuration.
Ready to Beat the Benchmarks?
See how Hyperleap AI helps dental practices respond instantly on website, WhatsApp, Instagram, and Facebook Messenger. Reduce missed calls, cut no-shows, and capture more new patients.
Get StartedIndustry Solutions
See how AI chatbots work for these industries:
Related Articles
Patient Communication Statistics 2026 for Healthcare
35+ sourced statistics on patient communication gaps, response times, and provider switching behavior reshaping practices in 2026.

Real Estate Lead Response Statistics 2026
40+ sourced statistics on real estate lead response times, conversion rates, and agent technology adoption. The data behind why speed wins in real estate.
Insurance Customer Service Automation Statistics 2026
40+ sourced statistics on insurance chatbot adoption, lead response times, and automation ROI. The data behind the industry's $1.3B chatbot savings.

Legal Client Intake Statistics 2026: Win More Cases
40+ sourced statistics on law firm response times, lead conversion rates, and client expectations. The data shows why the fastest firms win the best cases.