Top 10 KPIs for Customer Service: Boost Satisfaction in 2026
Discover 10 essential KPIs for customer service that drive growth. Measure CSAT, FCR, & response times to improve satisfaction & retention in 2026.

Beyond service quality, the metrics that shape growth are the ones that show whether support removes friction, captures demand, and protects team capacity. Small businesses do not scale support by answering more messages. They scale by resolving the right messages faster, collecting qualified leads inside the conversation, and keeping agents out of repeat work.
That shift matters because a busy inbox can hide weak performance. Long queues, repeated follow-ups, and chatbot chats that go nowhere often look productive on a dashboard while revenue leaks in the background. If you're seeing that pattern, these signs that slow response times cost businesses usually show up before churn and missed leads become obvious.
The KPIs in this guide are chosen for operational use, not reporting theater. Each one can connect to a specific Hyperleap AI workflow so the metric leads to action. For example, instead of only tracking First Contact Resolution, you can use chatbot analytics to identify the questions that fail resolution, update the knowledge base, and reduce the same failure on the next round of conversations.
That is the standard to use for every metric here. Track what improves lead capture, cuts avoidable escalations, and keeps response quality consistent across your website, WhatsApp, Instagram, Facebook, and email.
Table of Contents
- 1. Response Time (First Response Time & Average Response Time)
- 2. Customer Satisfaction Score (CSAT)
- 3. Lead Capture Rate & Lead Quality Score
- 4. Customer Effort Score (CES)
- 5. First Contact Resolution (FCR) Rate
- 6. Omnichannel Availability & Response Consistency
- 7. Chat Completion Rate & Conversation Abandonment Rate
- 8. Agent/Bot Utilization, Average Resolution Time & Cost Per Resolution
- 9. Customer Retention Rate & Lifetime Value (CLV)
- 10. Knowledge Base Quality & Coverage Score
- Top 10 Customer Service KPI Comparison
- From Metrics to Momentum Your KPI Action Plan
1. Response Time (First Response Time & Average Response Time)
Businesses that reply late lose sales opportunities and create extra service work. That is why response time deserves a spot near the top of any customer service scorecard, especially for small teams trying to scale support without adding headcount.
Track two versions of this KPI. First response time measures how long it takes a customer to get the first meaningful reply after reaching out. Average response time measures the average delay between customer messages and your team's or bot's replies across the full conversation.
Those are not the same operational problem.
A fast acknowledgment can calm the customer, but it does not solve anything by itself. For SMBs using AI chatbots, the goal is not just speed. The goal is useful speed. If the bot answers in five seconds and still forces the customer to repeat the question, the metric looks good while the experience gets worse.
A practical setup is to measure response time by channel and by resolver type. Website chat, WhatsApp, Instagram, and Facebook message volume behave differently. Bot-resolved conversations also perform differently from human-resolved and escalated ones. If you blend them into one average, you lose the signal that tells you where staffing, routing, or automation is failing.

How to calculate it
Use simple formulas:
- First Response Time (FRT) = Time of first meaningful reply - Time customer message was received
- Average Response Time (ART) = Total response time across replies / Total number of replies
For SMBs, "meaningful reply" matters. An auto-confirmation like "We got your message" should be tracked separately from a reply that answers the question, asks a clarifying question, or moves the booking or sale forward.
That distinction is where AI can improve the operation instead of just masking delay.
Hyperleap AI can respond to routine questions immediately, qualify the request, and push exceptions into a unified inbox for a person. Used well, that reduces first response time and protects average response time because agents start with context instead of reading the whole thread from scratch. It also helps lead capture. An after-hours visitor asking about pricing or availability can get an immediate answer, then be routed into the right follow-up flow without waiting until morning.
What good looks like for SMBs
Benchmarks vary by channel, but the pattern is consistent. Live chat and WhatsApp usually need much faster first replies than email. Social DMs often sit in the middle. What matters most is matching customer expectations for that channel, then tightening the gap where delays cost revenue.
I usually recommend these operating targets for small businesses:
- Website chat and WhatsApp: aim for near-instant first replies through automation
- Escalated chat conversations: keep human follow-up fast enough that the customer does not feel the handoff stalled the conversation
- Email: track separately and accept a slower standard than live messaging
- After-hours inquiries: answer with a bot, collect intent, and queue the conversation with priority tags for the next shift
How to operationalize this KPI
Three habits make response-time tracking useful instead of cosmetic:
- Separate bot acknowledgment from useful first response. If your dashboard counts both as the same thing, fix the reporting.
- Build escalation rules. Send billing issues, policy exceptions, refunds, and edge cases to a person quickly.
- Tag conversations by intent. Sales inquiry, booking request, support issue, and complaint should not share one benchmark.
- Review after-hours volume weekly. Many SMBs underestimate how many leads arrive when nobody is online. This breakdown of how slow response times cost businesses explains why that traffic deserves its own workflow.
The trade-off is straightforward. Tighter response times usually require more automation, better routing, or narrower service promises. Small businesses do not need to be fast everywhere. They need to be fast where delay hurts conversion, retention, or repeat contact. That is why response time should be tied to channel rules, AI handoff logic, and lead intent, not tracked as a vanity average.
2. Customer Satisfaction Score (CSAT)
CSAT is the cleanest way to see whether customers felt the interaction helped. It's commonly collected right after a conversation by asking customers to rate the experience on a scale such as 1 to 5, then calculating the share of satisfied responses, commonly those rated 4 or 5, as described in PartnerHero's overview of customer service KPIs.
That simple percentage matters because operational speed can hide poor service. A clinic can answer quickly and still frustrate patients with unclear booking steps. An ecommerce store can respond right away and still leave product questions unresolved.
How SMBs should use CSAT
For AI-assisted support, CSAT tells you whether the bot was useful. If customers are satisfied after bot-led chats, you're building an advantage. If satisfaction drops whenever automation handles the interaction, your knowledge base or handoff logic needs work.
I've seen this pattern often: website chat scores well, but WhatsApp scores lower because customers ask more specific, high-intent questions there. That's exactly why segmentation matters.
Use CSAT in a way that produces action:
- Keep the survey short: One rating question and one optional follow-up is usually enough.
- Segment the results: Compare bot-resolved chats, human-resolved chats, and escalated chats.
- Read low-score comments weekly: That's where your missing answers show up.
- Tie updates to patterns: If several customers complain about unclear pricing, rewrite that answer in the chatbot knowledge.
A high CSAT with low resolution quality can happen when customers are being polite. Pair it with FCR before you trust it.
For Hyperleap AI users, this KPI becomes more valuable when you review chat transcripts alongside email summaries. That makes it easier to spot whether the problem was tone, missing information, or poor routing.
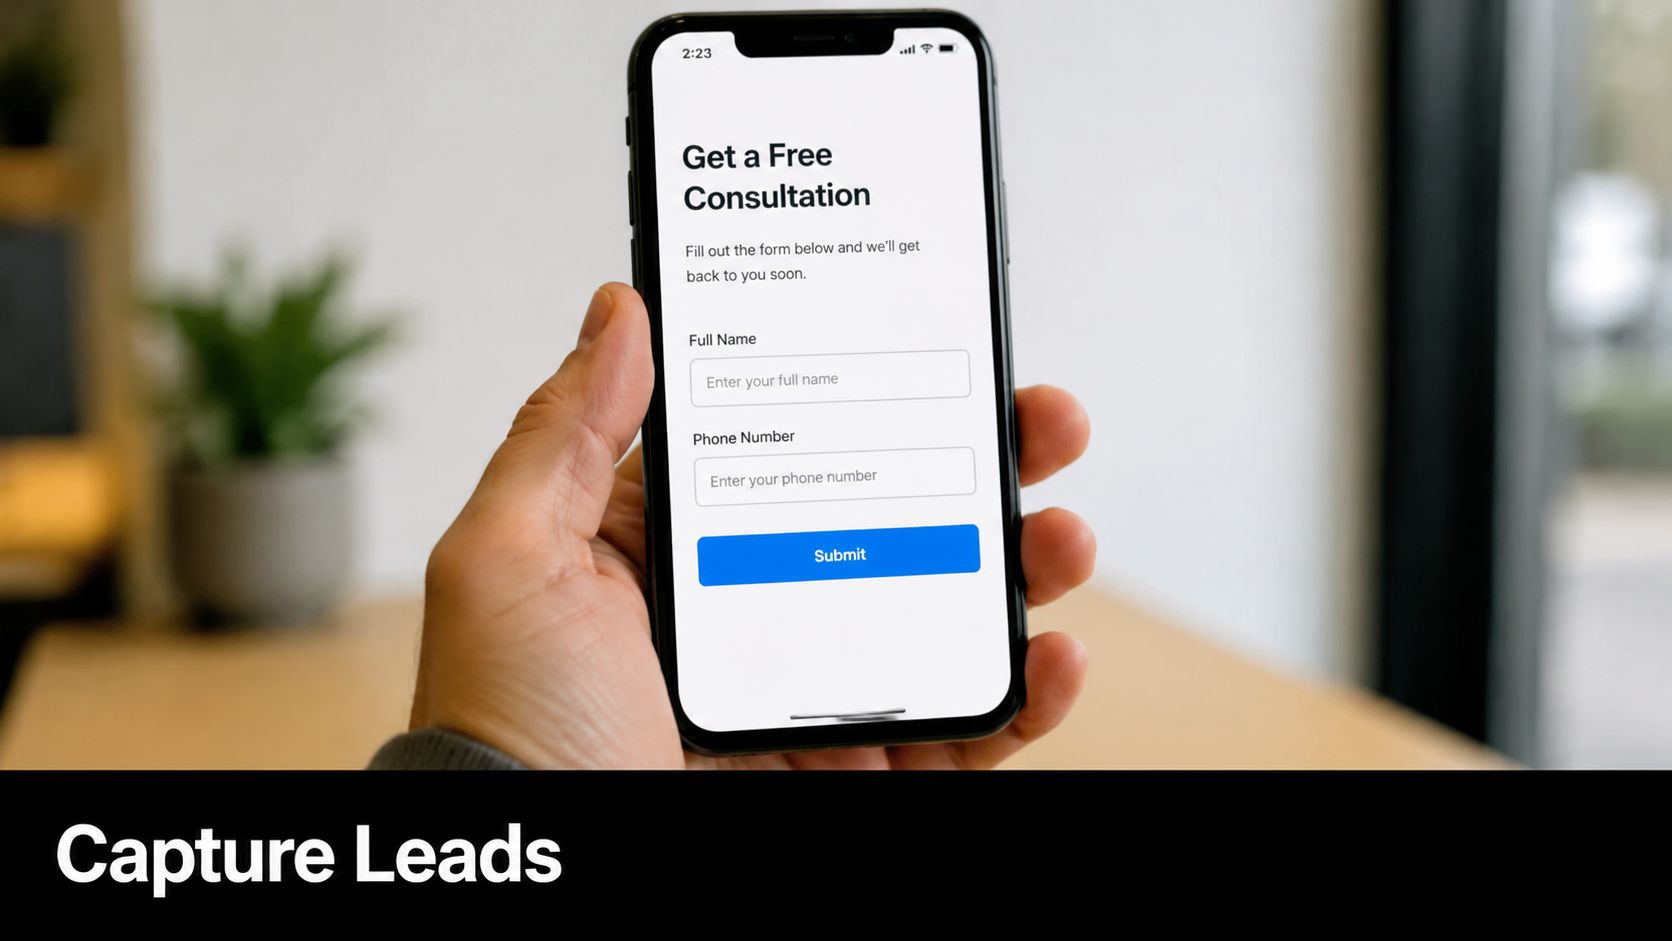
3. Lead Capture Rate & Lead Quality Score
For a lot of SMBs, customer service isn't just support. It's front-end revenue. That's why lead capture rate belongs on the same dashboard as your service KPIs.
Lead capture rate tells you whether conversations turn into identifiable prospects. Lead quality score tells you whether those contacts are worth follow-up. A bot that creates lots of junk leads wastes sales time. A bot that qualifies intent before asking for details usually performs better.
Where this metric becomes operational
The strongest chatbot flows don't ask for contact details immediately. They answer the first question, build trust, ask a qualifying follow-up, and then request the lead at a natural point in the conversation. That works well for real estate inquiries, med spa treatment questions, hotel group bookings, and local quote requests.
Hyperleap AI's OTP-verified lead capture matters because it screens out fake or low-quality contact submissions. That's especially useful if your team has been burned by spammy form fills or fake booking requests. If you want to improve qualification logic, this guide to a lead qualification chatbot is directly relevant.
A practical scoring model for SMBs usually includes:
- Intent quality: Did the person ask buying questions or only browse?
- Contact validity: Is the phone or email real and reachable?
- Fit signals: Location, service need, budget range, timeline, or product interest.
- Next-step readiness: Did they request a booking, callback, or quote?
What doesn't work is judging chatbot success by conversation volume alone. If the bot talks to everyone and captures no usable contacts, you don't have a service asset. You have a noisy widget.
4. Customer Effort Score (CES)
Customer Effort Score shows how easy it was for someone to get what they needed. That's especially important in AI chat because customers don't mind automation when it's easy. They mind dead ends, loops, and vague prompts.
A low-effort experience usually looks simple from the outside. The customer asks about availability, pricing, policies, or next steps. The system gives a direct answer, offers the right follow-up, and escalates only when needed. No hunting. No repetition.
What low effort actually looks like
A dental clinic patient shouldn't have to ask three different ways to book an appointment. A hotel guest shouldn't need to switch from website chat to WhatsApp just to confirm check-in details. A homeowner asking for a quote shouldn't have to repeat their ZIP code after already entering it once.
Those are CES problems, even if your response times look good.
Use CES to pressure-test your customer journey:
- Ask immediately after resolution: The closer the survey is to the interaction, the more useful the signal.
- Compare self-serve versus escalated flows: If bot-resolved chats feel harder than human-assisted ones, your automation isn't mature yet.
- Audit repeat clarifications: When customers keep rephrasing the same question, the answer likely isn't clear enough.
- Map friction by intent: Pricing, scheduling, cancellation, and location questions often create the most effort.
Customers forgive automation faster than they forgive friction.
Hyperleap AI can improve CES when the knowledge base is well-structured and the routing is clean. It gets worse when businesses upload thin content, leave policy gaps, or force the bot to answer questions it shouldn't answer. That's the trade-off. Automation reduces effort only when the underlying information is ready.
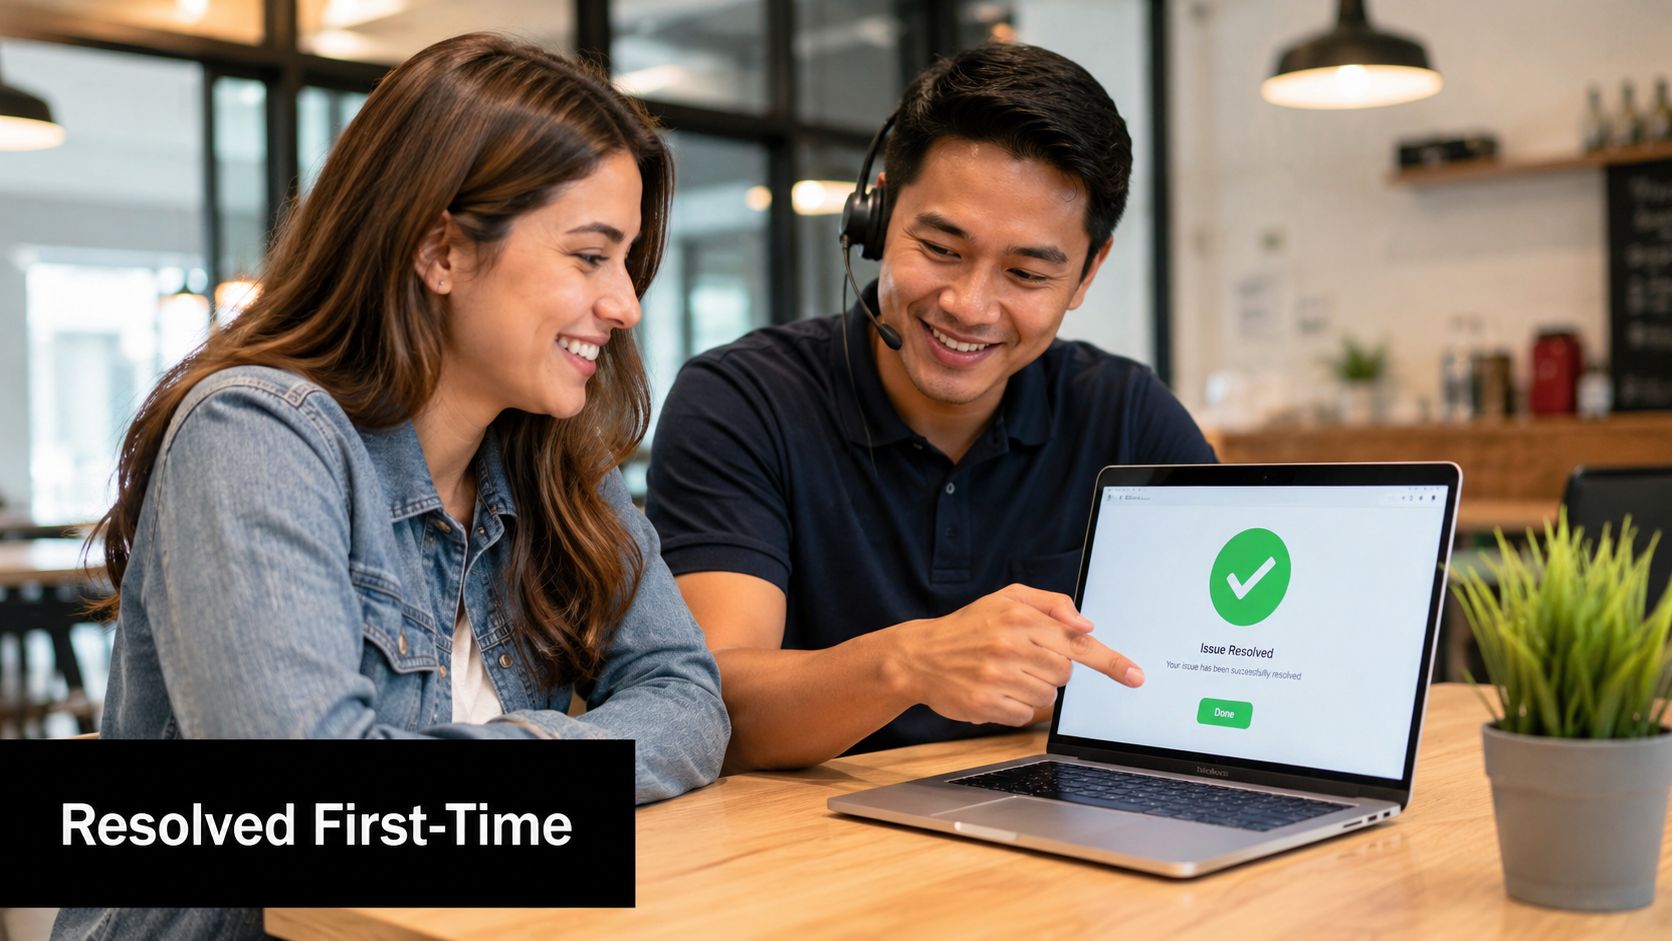
5. First Contact Resolution (FCR) Rate
A fast reply does not mean the issue is solved. FCR measures whether the customer gets a complete resolution in the first interaction, without needing to come back through chat, email, phone, or another agent. The formula is straightforward:
FCR rate = (issues resolved on first contact / total issues) x 100
What makes FCR hard is not the math. It is the definition. A billing question answered in one chat counts. A booking request that still needs manager approval does not. A chatbot that sends a customer to a form without confirming the outcome should not be marked resolved.
For small businesses, FCR is one of the clearest efficiency metrics because it connects service quality to staffing pressure. Higher FCR usually means fewer repeat contacts, lower inbox volume, and less time spent answering the same question twice. That matters if the goal is to scale support without adding headcount.
A useful benchmark for many SMBs is to treat anything above 70% as healthy, then segment by intent before drawing conclusions. FAQs like shipping, hours, appointment changes, and basic pricing should resolve much higher than complex complaints or edge-case account issues. If one blended number hides that gap, the KPI stops being useful.
Hyperleap AI helps operationalize FCR in a practical way. Its chatbot can answer high-frequency questions from your knowledge base, collect missing details in the same conversation, and route only the cases that need human judgment. That changes FCR from a reporting metric into a workflow metric.
Use a simple review process:
- Tag conversations by intent: Separate booking, pricing, cancellations, product questions, and support issues.
- Define resolution rules: Count a case as resolved only when the customer received the answer or completed the action.
- Track repeat-contact reasons: If people return about the same topic, the first answer was incomplete, unclear, or inaccurate.
- Audit bot escalations weekly: Repeated handoffs usually point to missing content, weak routing, or prompts that are too vague.
- Measure bot-resolved and agent-resolved FCR separately: That shows whether automation is reducing workload or just reshuffling it.
I usually tell owners to watch one trade-off closely. If you push the bot to contain too much, FCR can look better on paper while CSAT drops because customers feel trapped. If you escalate too early, satisfaction may hold up, but labor costs rise and the bot never improves. The right setup resolves repetitive, rules-based requests on first contact and hands off exceptions with context already captured.
A hotel can use Hyperleap AI to resolve check-in times, parking, pet policy, and Wi-Fi questions in one exchange. A clinic can handle appointment types, insurance basics, and prep instructions before staff step in. A real estate team can answer listing questions and capture lead details during the same chat. Those are real FCR gains because the customer leaves with the answer they came for.
The common reporting mistake is counting any answered message as resolved. FCR should measure completed outcomes, not bot activity.
6. Omnichannel Availability & Response Consistency
Customers switch channels constantly. They may ask a pricing question on your site, follow up on WhatsApp, then send an Instagram DM after hours. If each channel gives a different answer, service quality drops and lead conversion usually drops with it.
For SMBs, this KPI is less about being everywhere and more about being reliable in the channels that produce revenue. A bot that responds in five places with conflicting information creates more work than a bot that performs well in two.
Salesforce notes that service KPIs should be segmented by channel because response expectations differ across web chat, social messaging, SMS, and email. That matters in practice. A three-minute response on live chat may feel slow. A three-minute response on Instagram DM may feel fast.
Track this KPI with two simple measures:
- Channel availability rate = hours a channel is actively monitored or bot-covered / hours that channel is advertised as available × 100
- Response consistency score = number of approved test questions answered correctly across all active channels / total test questions sent × 100
Use 5 to 10 recurring test questions each week. Good examples include pricing, booking steps, refund policy, service area, operating hours, and escalation rules. If the website bot answers six correctly, WhatsApp answers five, and Instagram answers three, the issue is not "support quality" in general. The issue is channel drift.
A practical benchmark for SMBs is straightforward. Aim for full bot coverage on your primary lead channels and a response consistency score above 90% on your top FAQs. If consistency falls below that, update content before adding another channel.
Hyperleap AI helps operationalize this in a way small teams can maintain. The central knowledge base gives you one source for policy, offer, and FAQ updates. Multi-channel deployment pushes the same approved answers across website chat, WhatsApp, Facebook Messenger, and Instagram. The unified inbox then shows where handoffs, missed replies, or off-script answers are happening.
I usually recommend one rule here. Do not launch a new support channel until you can answer the same five buyer questions accurately on the channels you already have. Growth creates pressure to expand. Consistency protects conversion.
A hotel might use Hyperleap AI to keep room policies, parking details, breakfast hours, and late check-in rules aligned across web chat and WhatsApp. A clinic can keep insurance basics and appointment prep instructions consistent across site chat and Facebook. A real estate team can answer listing availability and capture lead details the same way whether the inquiry starts on Instagram or the website.
The common mistake is reporting one blended response metric across every channel. That hides underperforming inboxes and makes the whole system look healthier than it is. Measure each channel separately, test answers weekly, and use one shared knowledge base so every update reaches the places customers ask.
7. Chat Completion Rate & Conversation Abandonment Rate
This is one of the most revealing KPIs for customer service when chat is part of the buying journey. A completed conversation means the customer reached a natural endpoint such as getting an answer, leaving contact details, or booking a call. Abandonment means they dropped out before that happened.
High abandonment doesn't always mean failure. Some people get their answer and leave. But if customers regularly disappear right before lead capture, quote submission, or scheduling, you have a conversion problem hiding inside your support flow.
Find the drop-off point
The useful question isn't "How many chats ended?" It's "Where did they end?"
A few examples make the distinction clear:
- Early abandonment: The opener didn't match customer intent.
- Mid-chat abandonment: The bot became repetitive or unclear.
- Late abandonment: The customer hit friction at the form, booking link, or escalation step.
- Channel-based abandonment: WhatsApp users may continue where website visitors leave.
Reviewing transcripts usually shows the issue quickly. Many SMBs discover the bot is asking for contact information too early, answering too broadly, or introducing too many steps before the user can book.
If a conversation is supposed to generate leads, every extra turn needs a reason.
Hyperleap AI's email summaries can help spot patterns in abandoned flows without forcing managers to read every transcript. Pair that with booking tools like Calendly or Cal.com and you'll often find that shortening the path to appointment scheduling does more than rewriting greeting messages.
What doesn't work is treating abandonment as a copywriting issue only. Sometimes the cause is operational. Missing pricing, unclear service areas, or weak escalation rules push people out of the conversation.
8. Agent/Bot Utilization, Average Resolution Time & Cost Per Resolution
A support bot that handles more conversations is not automatically reducing workload. For SMBs, the question is whether automation is removing repetitive work, shortening time to resolution, and lowering the cost of each solved issue without pushing more cleanup back to staff.
That is why these three KPIs should be reviewed together.
Agent/Bot Utilization shows how work is split between human agents and automation. Average Resolution Time shows how long it takes to close an issue from start to finish. Cost Per Resolution shows what each solved case costs.
Use simple formulas:
- Bot Utilization Rate = conversations handled fully by bot / total conversations
- Agent Utilization Rate = active handling time / available support time
- Average Resolution Time = total time to resolution / total resolved cases
- Cost Per Resolution = total support costs / total resolved cases
Clear resolution definitions and tracking matter here. If one team counts a chat as "resolved" when the bot sends an article, while another counts resolution only after the customer confirms the issue is fixed, the numbers become hard to trust.
The pattern to look for is straightforward. Bot utilization should rise for routine requests. Resolution time should fall for simple cases. Cost per resolution should decline over time. If bot utilization rises while resolution time stays flat and agents still spend hours correcting bad handoffs, the bot is creating activity, not efficiency.
Hyperleap AI should be measured as part of the operating model, not as a widget on the site. If Hyperleap AI answers FAQs, qualifies leads, books appointments, and routes edge cases correctly, bot utilization becomes a useful efficiency KPI because it reflects real deflection and cleaner agent queues. If it only greets visitors and hands everything to staff, the utilization number looks healthy while payroll pressure stays the same.
A practical review looks like this:
- High bot utilization + lower resolution time: Automation is absorbing repetitive work well.
- High bot utilization + flat or rising cost per resolution: The bot may be creating rework, weak lead qualification, or poor escalations.
- Low bot utilization + high agent utilization: Agents are still buried in basic requests that should be automated.
- Fast resolution time + weak outcomes: The team may be closing conversations too early instead of fully solving them.
I see this often in service businesses. The owner installs a chatbot to save time, then leaves scheduling, pricing questions, and qualification rules half-finished. The bot touches a lot of conversations, but staff still have to step in, ask the same questions again, and chase missing details. Utilization goes up on paper. Labor efficiency does not.
Set benchmarks by case type, not one blended target for everything. A password reset, appointment request, and multi-step billing issue should not share the same resolution expectation or cost target. For most SMBs, the useful first step is segmenting tickets into at least three buckets: routine, moderate, and complex. Then compare bot-handled versus agent-handled outcomes inside each bucket.
Good tools for this are usually the ones already in the stack. Help Scout, Zendesk, Intercom, Gorgias, or Freshdesk can track resolution times and tags. Pair that with simple cost inputs from payroll or outsourced support spend. Hyperleap AI conversation logs, lead capture flows, and booking actions can then show whether the bot is resolving, qualifying, or scheduling without human intervention.
The management question is simple: are you reducing labor on low-value tasks so humans can focus on exceptions, sales opportunities, and sensitive cases? If the answer is yes, these KPIs will move together in the right direction. If they are moving in opposite directions, fix the workflow before adding more volume.
9. Customer Retention Rate & Lifetime Value (CLV)
Support teams sometimes avoid retention metrics because they feel too far removed from day-to-day service. That's a mistake. If your service experience is consistently confusing, slow, or unreliable, retention eventually reflects it.
Retention rate shows whether customers continue doing business with you over time. CLV shows the long-term value of that relationship. Neither metric belongs only to marketing or finance. Service quality shapes both.
Connect service metrics to revenue quality
Many SMB dashboards fall apart when they solely measure response time and maybe CSAT, neglecting to ask whether better service is producing more repeat bookings, more returning customers, or stronger account value.
You don't need a perfect attribution model to start. You do need disciplined comparison. Look at retained customers and ask what their support experience looked like. Were their questions resolved quickly? Did they use self-service successfully? Did they book, reorder, or renew after a strong interaction?
A practical way to use these KPIs:
- Track by segment: New customers, repeat customers, locations, or service lines.
- Review support history before churn analysis: Service issues often appear before customers leave.
- Compare retained versus lost accounts qualitatively: Look for patterns in speed, clarity, and resolution.
- Pair with CSAT and FCR: Retention usually improves when those are stable and credible.
The trade-off is timing. Retention and CLV move slowly. They won't help you fix today's inbox. But they will tell you whether your customer service model is building a healthier business or just processing messages faster.
10. Knowledge Base Quality & Coverage Score
Most chatbot KPI problems are really knowledge problems. If the bot underperforms, the first place to look is rarely the model. It's the information you've given it.
Knowledge base quality is about accuracy, clarity, relevance, completeness, and freshness. Coverage score asks a more operational question: how much of your common customer demand can your knowledge base answer without escalation?
The best chatbot teams work on content, not prompts
A strong knowledge base usually has direct answers for FAQs, booking steps, pricing explanations, policies, location details, and edge cases that come up often enough to matter. That's what gives an AI chatbot the ability to resolve routine conversations consistently.
Hyperleap AI is grounded in uploaded knowledge, so the quality of that source material directly shapes answer quality, escalation rates, and FCR. If you're building or cleaning up this layer, these AI chatbot knowledge base best practices are the right starting point.
A few habits separate good knowledge systems from weak ones:
- Start with actual demand: Use your top recurring questions, not your internal org chart.
- Write for customers: Short, plain answers beat policy-language paragraphs.
- Include local nuance: Multi-location overlays matter for availability, hours, and service differences.
- Update on change, not on schedule alone: New policy, new pricing, new offer, new answer.
- Use escalations as feedback: Repeated handoffs usually show where the knowledge base is thin.
Your chatbot can't be more useful than the knowledge it can access.
This KPI is often overlooked because it feels less glamorous than response time or CSAT. In practice, it's the engine under both.
Top 10 Customer Service KPI Comparison
| Metric | 🔄 Implementation Complexity | Resource Requirements | ⚡ Speed / Efficiency | 📊 Expected Outcomes | ⭐ Key Advantages & 💡 Tips |
|---|---|---|---|---|---|
| Response Time (First Response Time & Average Response Time) | Low, quick to deploy bot templates; moderate for multi-channel routing | Minimal tech & monitoring; escalation rules and unified inbox | Very high, sub-second bot replies; reduces wait times | Improves satisfaction and lead capture; measurable in seconds/minutes | Rapid replies increase conversions; set FRT targets (<2 min) and monitor by channel |
| Customer Satisfaction Score (CSAT) | Low, simple post-interaction surveys to implement | Survey tool, data capture, basic analytics | Moderate, instant feedback but slower trend analysis | Direct sentiment indicator; actionable but subject to bias | Easy to collect; keep surveys short (1–3 Qs) and segment by channel |
| Lead Capture Rate & Lead Quality Score | Medium, needs OTP, form flows, and CRM integration | OTP service, CRM/Calendly integrations, email summaries | High, 24/7 capture; faster follow-up with instant summaries | Higher-validity leads; fewer fake contacts, better sales efficiency | Best for sales-led sites; place capture at natural endpoints and use progressive profiling |
| Customer Effort Score (CES) | Low, single-question post-resolution implementation | Survey capture, routing for low scores, KB improvements | Moderate, quick to measure effort trends | Strong predictor of loyalty and self-service success | Ask immediately after resolution; follow up on low scores to fix friction |
| First Contact Resolution (FCR) Rate | Medium, requires clear resolution definitions and tracking | Comprehensive knowledge base, escalation routing, analytics | High when KB is strong, reduces repeat contacts | Lowers support costs and improves loyalty; strong correlation with CSAT | Aim for 75%+ for bot interactions; expand KB for frequent escalations |
| Omnichannel Availability & Response Consistency | High, governance and channel-specific work required | Unified KB, channel integrations, uptime monitoring (99.9% SLAs) | High availability but ongoing maintenance overhead | Consistent brand experience and fewer missed leads across channels | Essential for multi-location brands; test and sync KB across channels weekly |
| Chat Completion Rate & Conversation Abandonment Rate | Medium, needs goal definitions and conversation analytics | Conversation analytics, re-engagement flows, KB tuning | Variable, improves with targeted routing and timing | Reveals funnel leakage; higher completion boosts revenue potential | Track by goal type, A/B test messaging, and implement re-engagement prompts |
| Agent/Bot Utilization, Average Resolution Time & Cost Per Resolution | High, integrates workforce metrics, cost accounting, and routing | Workforce analytics, financial data, instrumentation across systems | Very high gains with automation; bots cut times from hours to minutes ⚡ | Demonstrates ROI; reduces human load and cost per resolution significantly | Use for staffing decisions; monitor utilization to avoid burnout and measure pre/post impact |
| Customer Retention Rate & Lifetime Value (CLV) | High, long-term cohort tracking and cross-system integration | Integrated sales, support, billing data; cohort analysis tools | Slow to change, driven by consistent service improvements | Most important long-term metric; small gains compound into large value ⭐ | Link CSAT/CES/FCR to retention; segment CLV and track pre/post platform changes |
| Knowledge Base Quality & Coverage Score | Medium–High, content creation, structure, and ongoing maintenance | Content authors, document uploads, multilingual support, analytics | Improves resolution speed and reduces escalations over time | Foundation for accuracy and high FCR; coverage drives bot effectiveness ⭐ | Start with top 20 FAQs, use templates, review quarterly, target 80%+ coverage |
From Metrics to Momentum Your KPI Action Plan
Most SMBs don't need more KPIs. They need fewer metrics, tracked more consistently, with clear operational owners. That's the difference between a dashboard and a management system.
If you're deciding where to start, pick two or three KPIs for customer service that map directly to your current bottleneck. If leads are slipping through, start with response time and lead capture rate. If customers complain about confusion, start with CSAT and CES. If your team is overloaded, start with FCR and cost per resolution.
Then make each KPI actionable. Don't just report a number at the end of the month. Tie it to a process. Response time should connect to channel routing, after-hours coverage, and auto-replies. CSAT should trigger transcript review and answer rewrites. FCR should shape what goes into the knowledge base next. That's how metrics start improving the business instead of decorating a slide deck.
One useful lens from the broader KPI discussion is the need to balance speed, quality, and operational health together. Industry guidance increasingly separates those dimensions, and that's the right move for small businesses too. Fast service isn't automatically good service. The discussion of balancing operational and experiential metrics is especially relevant if you've been optimizing for speed while repeat contacts or dissatisfaction keep showing up.
Another underused area is adoption. If you launch self-service or AI support, measure whether customers are using it. Adoption-rate metrics can be calculated as new engaged users divided by total signups, multiplied by 100, and feature adoption can be calculated as number of new users of a feature divided by total number of users, multiplied by 100, based on Toucan Toco's adoption KPI framework. That matters because support tooling doesn't help if customers ignore it.
As your operation matures, put more attention into channel-level reporting, transcript review, and knowledge management. That's where a lot of service gains are made. If you need a practical companion process, this resource on improving team collaboration and search is worth reading.
Hyperleap AI fits naturally into this workflow because it combines chatbot deployment, lead capture, knowledge grounding, multi-channel messaging, and inbox management in one system. That doesn't remove the need for KPI discipline. It gives you a better way to act on it.
If you want to turn customer service into a lead capture and booking engine, Hyperleap AI gives small businesses a practical way to do it. You can launch across website chat, WhatsApp, Instagram, and Facebook, ground answers in your own knowledge, capture OTP-verified leads, and monitor the service metrics that matter without building a custom stack.