Guide
KPI Customer Care: Metrics, Benchmarks and Targets
Learn the core KPI customer care metrics like FCR, CSAT, AHT and churn, with benchmarks, formulas, dashboards and how AI chatbots improve each one.

Gopi Krishna Lakkepuram · Founder & CEO
· 13 min read
The most repeated advice in customer care is to answer faster. First response time, average handle time, and a green service-level tile get the applause in the Monday meeting. Speed is easy to count, and it flatters a queue that is merely closing chats.
That advice fails the customer. A two-second reply that is wrong, incomplete, or a dead-end bot loop is a failure with a shorter clock. KPI customer care only works when you measure the outcome, the resolved conversation, beside the activity that produced it.
I would rather see a slower first reply that books the appointment than an instant acknowledgement that sends the person back through WhatsApp an hour later. Read every number with the question it was built to answer, and retire any metric that cannot name its failure mode.
Table of Contents
- Core Customer Care KPIs and How They Are Calculated
- Set Up KPI Measurement and Start Your Baseline
- Realistic Benchmarks and How to Set Your Targets
- Building a KPI Dashboard That Your Team Will Read
- Where Customer Care KPIs Mislead You
- How an AI Chatbot Moves Each Customer Care KPI
Core Customer Care KPIs and How They Are Calculated
A car dashboard that shows only speed tells you nothing about fuel, engine heat, or the road ahead. The same is true of a single number in a support report.
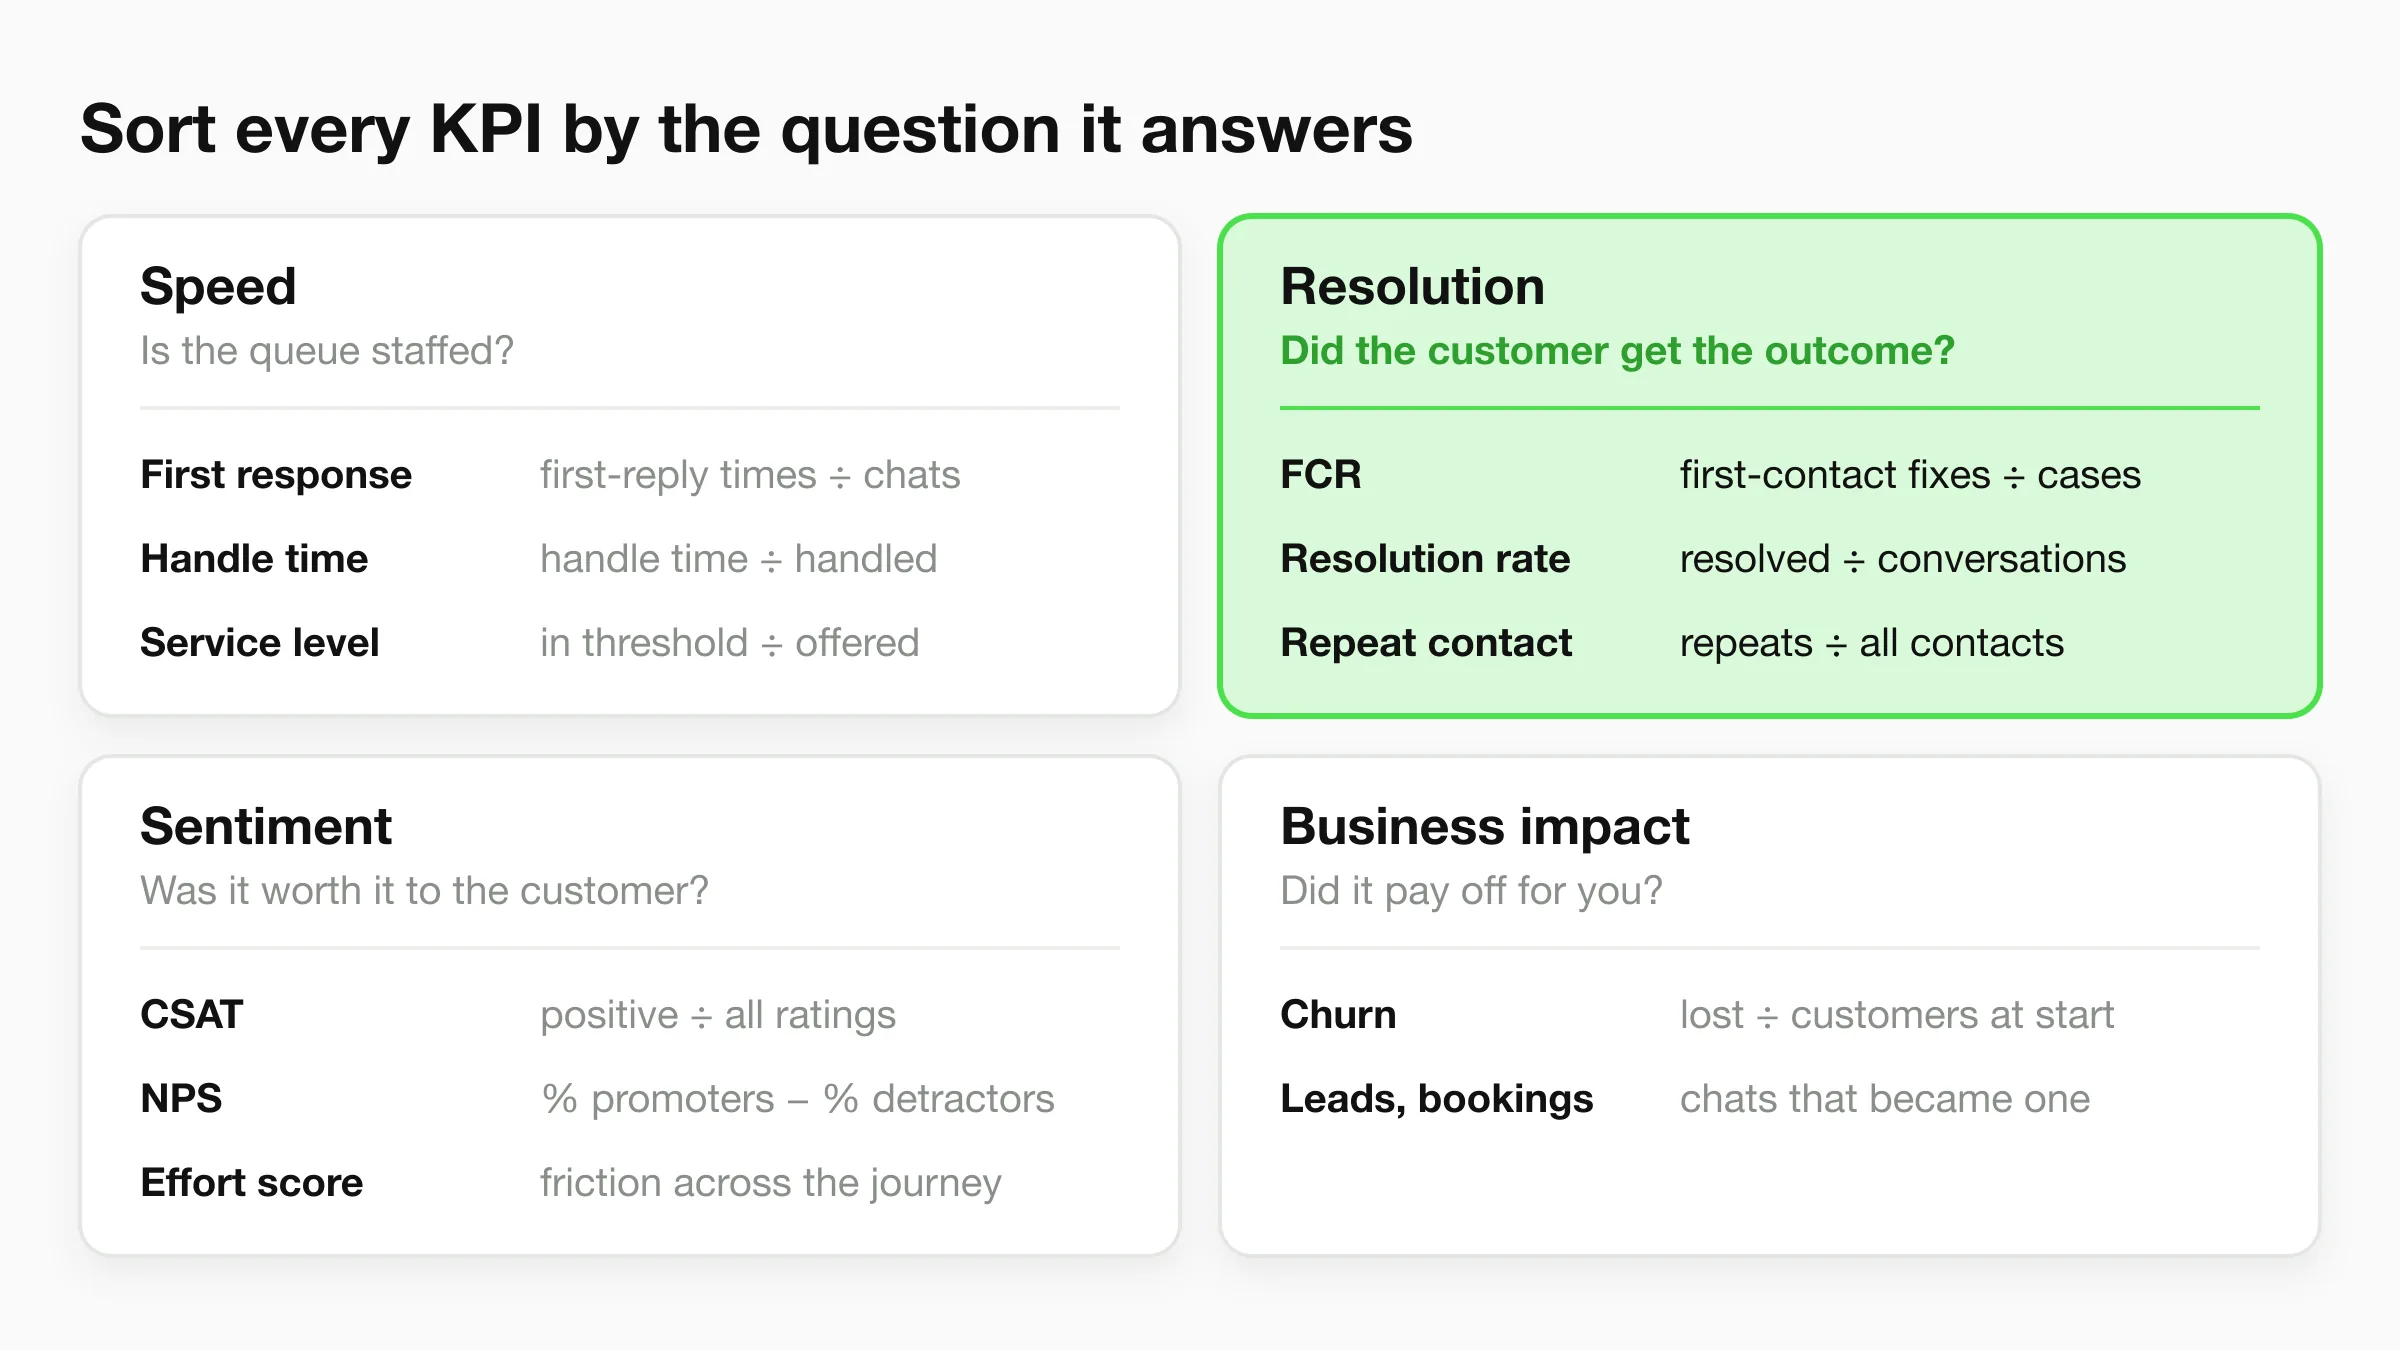
Sort kpi customer care measures into four families before anyone adds a tile.
- Speed: first response time, average handling time, and service level.
- Resolution: first-contact resolution, resolution rate, and repeat-contact rate.
- Sentiment: CSAT, NPS, and Customer Effort Score.
- Business impact: churn, and whether a chat turned into a lead or a booking.
| KPI | What It Measures | Formula | What It Tells You |
|---|---|---|---|
| CSAT | Satisfaction with a single interaction | Positive ratings divided by all submitted ratings x 100 | Whether the answer felt good in the moment |
| NPS | Willingness to recommend | Percent promoters (9-10) minus percent detractors (0-6) | Long-term loyalty, not single-contact quality |
| FCR | Issues resolved without follow-up or transfer | Resolved first-contact cases divided by total cases x 100 | Whether the customer got what they needed the first time |
| AHT | Average time spent per interaction | Total handle time divided by handled interactions | Efficiency, which must be read alongside FCR |
| First response time | Time to the first substantive reply | Sum of first-reply times divided by conversations | How quickly the customer feels heard |
| Resolution rate | Conversations closed with the issue solved | Resolved conversations divided by total conversations x 100 | Overall outcome, including escalations |
| Repeat-contact rate | Customers who return about the same issue | Repeat contacts divided by total contacts x 100 | Hidden false closures and rework |
| Service level | Contacts answered within a target time | Contacts answered within threshold divided by contacts offered x 100 | Queue health and staffing fit |
| Abandonment rate | Customers who leave before being served | Abandoned contacts divided by contacts offered x 100 | Demand lost while waiting |
| Churn | Customers who stop buying | Customers lost in period divided by customers at start x 100 | Long-term damage from poor service |
CSAT captures one moment. NPS captures loyalty over time. Customer Effort Score shows friction across the whole journey. A CSAT or NPS score is only as reliable as its response count, so report the number of survey responses beside each score.
Name the question each KPI answers before you add it to a report. A number with no question is activity dressed up as management. Counting a deflected ticket as a win, without checking whether the customer finished the job, is the trap in what ticket deflection actually measures.
Set Up KPI Measurement and Start Your Baseline
A name on a slide is not a measurement. Call Force's call center KPI benchmarks calculate first-contact resolution as cases resolved without follow-up or transfer divided by total cases, place cross-industry averages around 70–75%, and treat 80% or higher as world-class. Higher FCR cuts repeat contacts, queue demand, and handling cost. Pushing people to close cases early can still sink CSAT. Separate speed, resolution quality, and sentiment on the scorecard, or you will optimize the loudest tile.
Write the definitions before the sheet
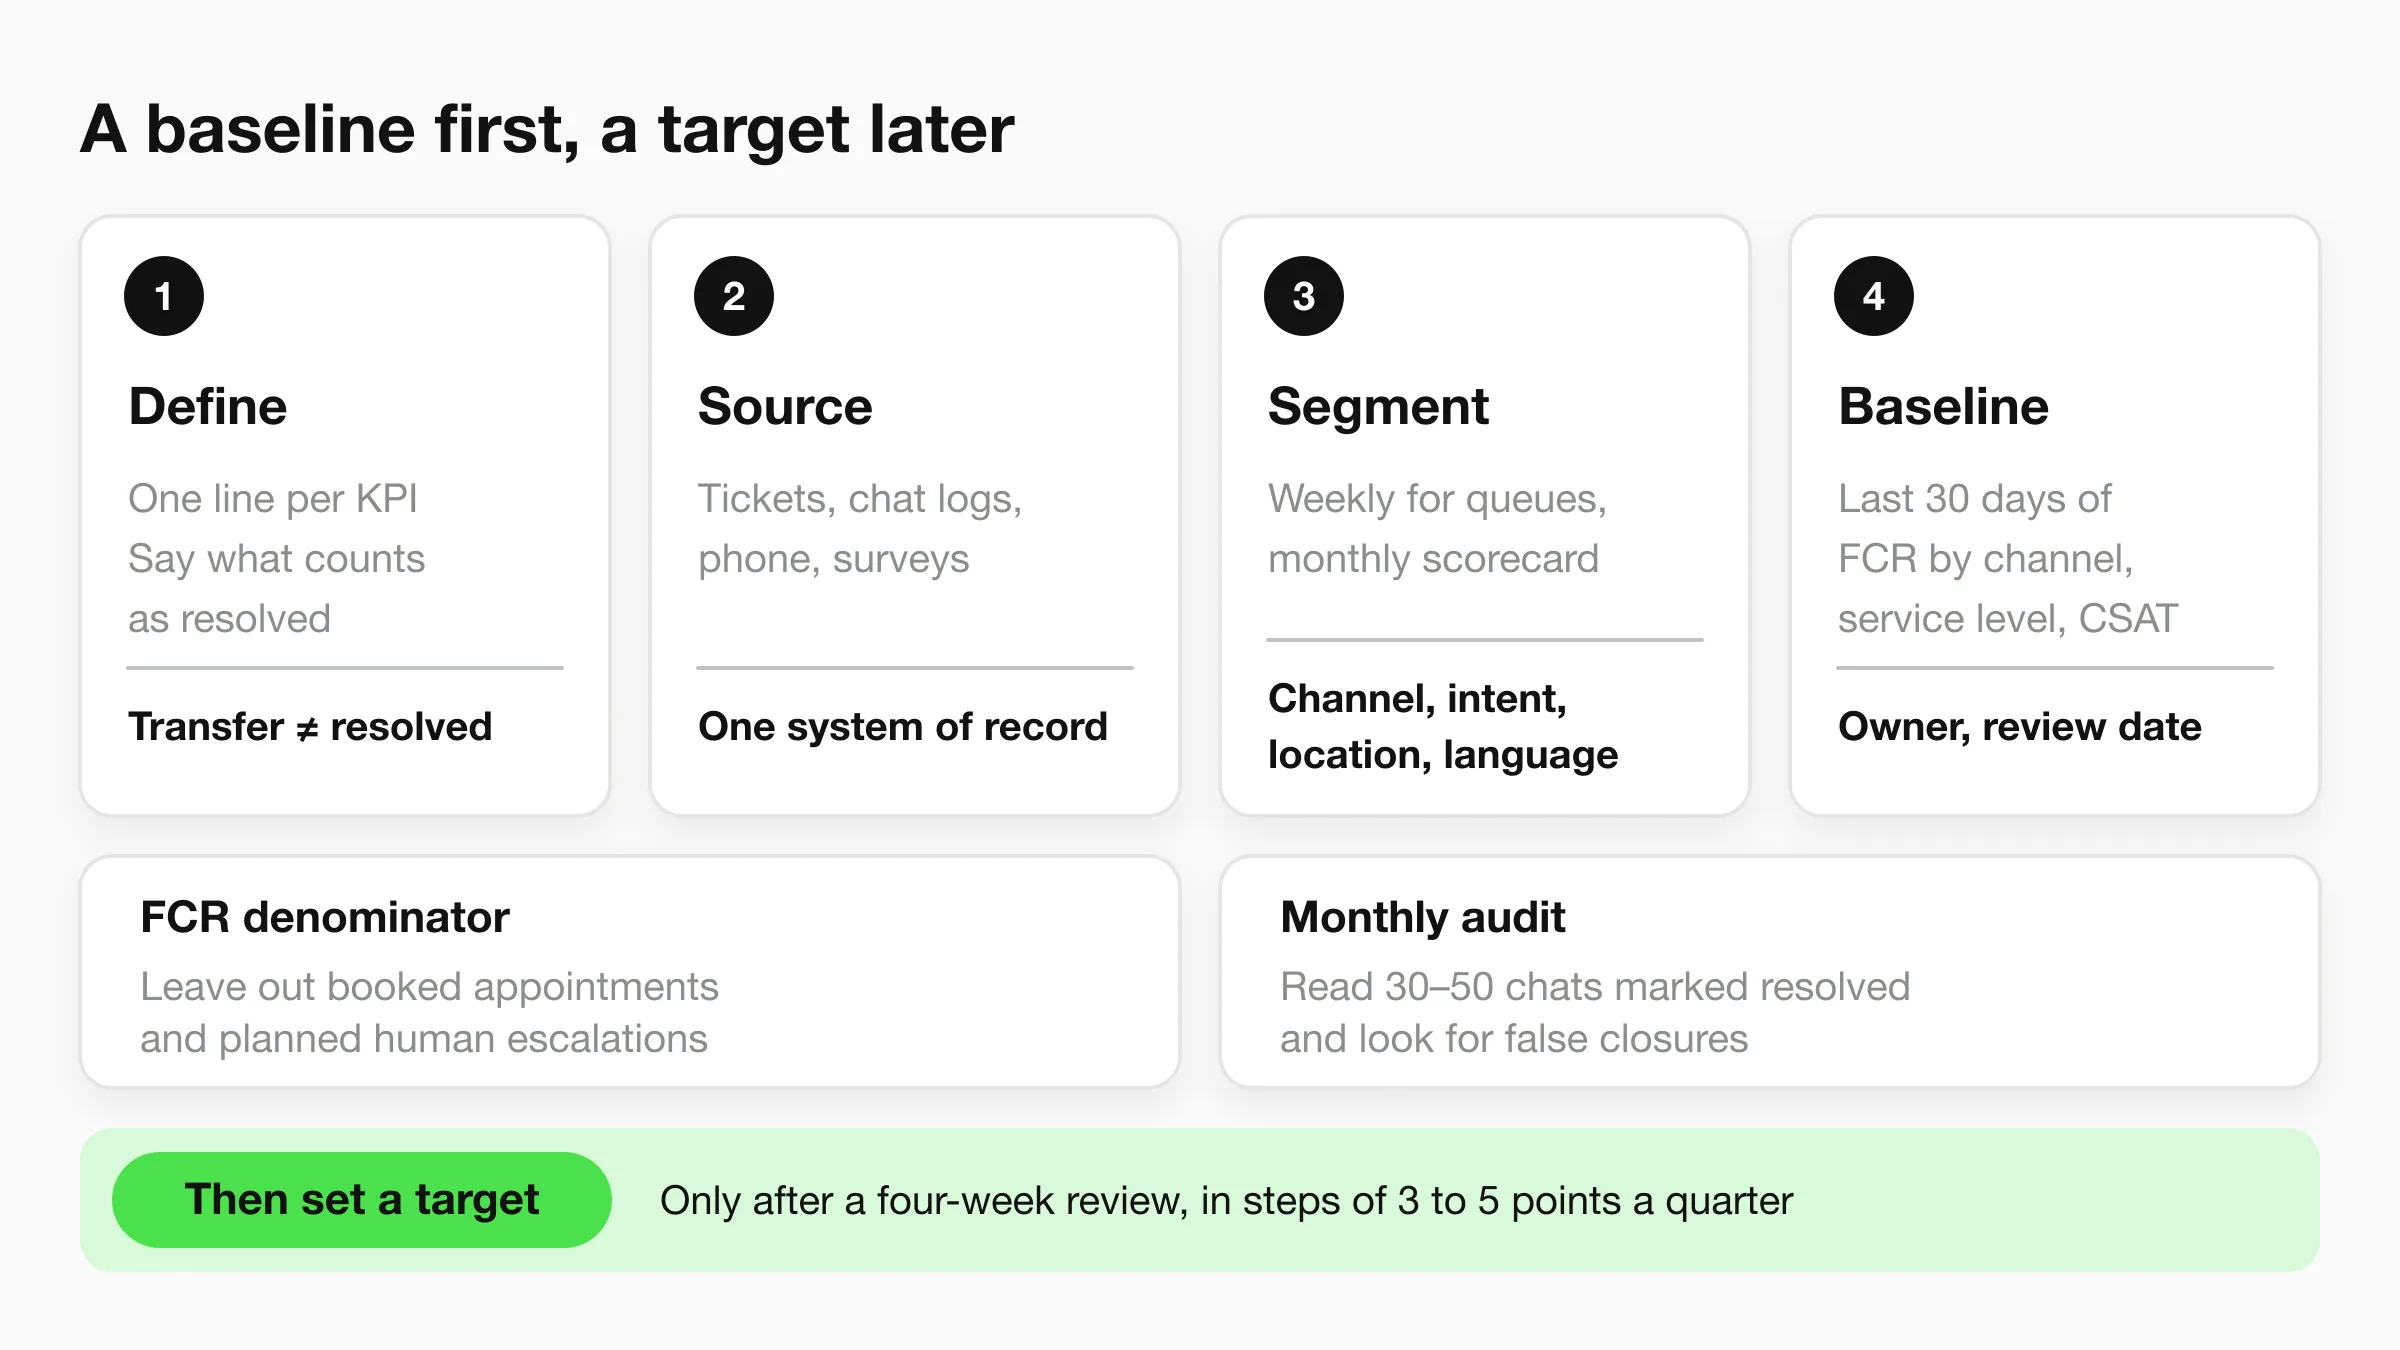
- Write a one-line definition for each KPI, including what counts as resolved. A transfer is not a resolution, and a WhatsApp message about the same booking after a web chat is a return, because inconsistent rules make two channels incomparable.
- Map each KPI to its source: helpdesk tickets, chat logs, the phone system, and the post-conversation survey. If two systems can both claim the close, pick one system of record so the monthly number cannot be argued into a better story.
- Use a weekly window for queue KPIs and a monthly window for the scorecard, and segment every KPI by channel, intent, location, and language. A blended average hides the branch, the language, or the intent that is failing.
Decide what the denominator includes
- Exclude scheduled appointments and planned human escalations from the FCR denominator. Those conversations were never candidates for self-resolution, and leaving them in punishes a correct handoff.
- Each month, audit a random sample of 30 to 50 conversations marked resolved. You are looking for false closures the formula missed, such as a polite goodbye that did not answer the question.
- Pull the last 30 days for three starter KPIs: FCR by channel, service level or abandonment, and CSAT. Record each baseline in one shared sheet with its source, then name an owner and a review date, because an unowned number never changes.
Pair FCR with CSAT, positive ratings divided by all submitted ratings, and with repeat-contact rate. That trio catches a false close that FCR alone will applaud. Segment healthcare, hospitality, real estate, and general service inquiries on the monthly scorecard. Complexity changes the FCR you can hit, and a benchmark is a directional control, not a universal target, because definitions and channel mix differ.
- If a chatbot sits in front of the queue, attach your service catalog, SLA sheet, SOPs, and onboarding checklist during setup so it answers in your own way. Read a sample of its conversations, confirm the handoff summary arrives, and only then trust any movement in the baseline.
Practical rule: Do not set a target until definitions sit on one page, sources are named, a monthly audit is on the calendar, and a four-week review has passed.
Realistic Benchmarks and How to Set Your Targets
Benchmarks tell you whether you are in a normal range. They do not tell you what your mix should hit next quarter.
| KPI | Typical Range | Strong Performance | Starting Target |
|---|---|---|---|
| FCR | About 76% in U.S. contact centers | Median of 80% | Hold near 70-75% until the audit is clean |
| Service level | A threshold set per channel | 80% answered within 20 seconds (80/20) | 80/20 for voice and live chat |
| Abandonment rate | 5-8% | Below 5% | Under 8%, then tighten each quarter |
| NPS | Score from -100 to +100 | Promoters outnumber detractors | Your baseline, plus 5 points a year |
| CSAT | Positive share of submitted ratings | A score that holds while volume rises | Your 90-day baseline, plus 3 to 5 points |
| AHT | Handle time split by intent | Stable for the same issue mix | Your median by intent, reviewed monthly |
| Churn | Lost customers as a share of the start base | Flat or lower than the prior month | Your baseline, tracked monthly |
Recent contact-center benchmarking compiled by Stealth Agents places average FCR at approximately 76% in U.S. contact centers, with a median of 80%. Roughly 20%–24% of inquiries still need another interaction. That share is extra workload and frustration risk. It is not your repeat-contact rate. Repeat-contact rate uses its own formula in the first table, and mixing the two will make a healthy team look broken, or a leaky one look fine.
How to turn a baseline into a target
Take a 90-day baseline. Choose one KPI to move first. Set a step of 3 to 5 points per quarter, and name a guardrail so a rising FCR cannot hide a falling CSAT. A team sitting at 72% FCR may already be near the norm for its mix. Chasing 80% in one quarter usually means agents, or a bot, are ending chats early.
Complexity moves the target more than ambition does. A dental booking chat can reach a high FCR quickly, because the successful outcome is a slot on the calendar. A hotel complaint thread, or a real estate pricing query, needs judgement, documents, and often a person. Track FCR by channel, location, issue type, and period. For a chatbot, success is a resolved request, the correct next step, or a completed action such as a booking, not a reply. Definitions have to stay fixed: say whether a transfer, an unanswered follow-up, or a return on another channel still counts.
How fast you answer also changes whether a lead converts, which is why response time belongs next to resolution, not instead of it. The pattern across industries is laid out in response time and conversion rates. A target with no named owner and no review date changes nothing.
Building a KPI Dashboard That Your Team Will Read
Build the monthly view in three rows, and refuse to blend them.
Top row, speed. Service level, abandonment, and human first-response time. This row answers whether the queue is staffed.
Middle row, resolution. FCR by channel, repeat-contact rate, and escalation rate. This row answers whether the customer got the outcome.
Bottom row, sentiment and the business. CSAT, Customer Effort Score, and monthly churn. This row answers whether the work was worth it for the customer and for you.
| Panel | KPI | Target | Status |
|---|---|---|---|
| Speed | Service level, phone and WhatsApp | 80% | Amber |
| Speed | Abandonment rate | Below 5% | Green |
| Speed | Human first response time | Under 3 min | Green |
| Resolution | FCR, website chat | 75% | Amber |
| Resolution | Repeat-contact rate | Below 12% | Red |
| Resolution | Escalation rate | Below 20% | Green |
| Sentiment | CSAT, all channels | 85% | Amber |
| Sentiment | Customer Effort Score | Mostly easy on the post-chat question | Green |
| Business | Monthly churn | No higher than the prior month | Red |
In this sample, speed looks mostly fine and churn is red. If those rows were averaged into one health score, the red would disappear. Keep the speed panel and the resolution panel on separate rows so a fast queue cannot hide weak answers.
For synchronous queues, CoSupport's call center metrics guide calculates service level as contacts answered within a threshold divided by contacts offered, with the conventional planning target of 80% answered within 20 seconds (80/20). Abandonment is abandoned contacts divided by contacts offered. Cross-industry guidance puts 5–8% in an acceptable range, and below 5% is generally strong. Longer waits raise abandonment, and people who leave often come back on another channel, which inflates workload and makes FCR look worse than the agents who did answer.
What changes when the first reply is a bot
Do not score a chatbot on reply latency. Use first-response time, median time to human handoff, unresolved-session rate, and lead-form completion. Report automated acknowledgements apart from substantive answers, or the first-response tile will look brilliant while nobody has been helped. Segment by channel and by business hours. Voice and live chat do not share abandonment expectations with asynchronous messaging, and one blended benchmark hides a routing failure.
Add filters for location and channel. A single global average can conceal one branch. Operations reviews red items weekly: five minutes, one owner per red, and a transcript read for any FCR drop of more than five points. Leadership gets a monthly scorecard with one trend line per KPI against its target and its baseline.
Where Customer Care KPIs Mislead You
Average handling time is the metric that most often looks healthy while customers get worse service. Agents, or a bot, end the conversation early. Handle time falls. A week later the same person is back on another channel, and only FCR plus repeat-contact rate show the damage.
PwC puts the gap plainly: organizations often measure isolated interactions and speed-to-answer rather than friction across the whole journey. PwC's 2025 survey of 5,511 consumers and 406 executives pushes CX measurement toward outcomes such as conversion and customer lifetime value, and treats traditional CSAT and NPS as useful but incomplete. A lower handle time is harmful when it is premature closure or forced self-service.
Four failures show up on otherwise green dashboards.
- Deflection counted as success: the chat ends, the customer leaves, and nobody asks whether the job was done.
- Surveys of the willing: CSAT reflects only the people who answered, so a thin response count can flatter a bad week.
- Blended averages: one weak branch disappears inside a company-wide mean.
- Lagging churn: it confirms damage months later and cannot diagnose this week's routing mistake.
The same cadence problem shows up outside contact centers. Operators who compare weekly and monthly MSP metrics already separate fast operational signals from slow business results, and a care team needs that split too.
Pair every speed KPI with a quality guardrail and a customer-effort question. Segment by channel, language, location, and issue type. Review a sample of closed conversations, and connect the work to booked appointments, completed purchases, retention, and lifetime value. An efficiency gain counts only when the customer had less work to do.
How an AI Chatbot Moves Each Customer Care KPI
A chatbot should be scored on resolved conversations and completed actions, not on reply speed. A fast wrong answer is a failure with a faster clock.
Speed does not guarantee resolution. One 2025 consumer survey reported that 55% of respondents escalated an AI-handled issue to a human and 45% said the system failed to understand their problem, while a separate Verint survey reported that 56% of consumers ranked getting information quickly as the most important aspect of good CX, though results vary by survey and audience. Quick answers matter. They are not permission to trade away accuracy. ICMI's 2025 survey of 113 contact-center leaders also shows a wide gap between top and bottom agents on customer sentiment and talk time, so quality variance belongs on the scorecard next to efficiency.
Levers worth trusting
| KPI | Chatbot Lever | What to Measure | How to Verify It |
|---|---|---|---|
| FCR | Answers routine questions from your knowledge | Share of chats where the question is answered or the booking completed | Sample transcripts and check them against your source documents |
| First response time | Instant reply at any hour | Substantive first reply, excluding automated acknowledgements | Compare timestamps of acknowledgements against first substantive answers |
| Service level and abandonment | Covers overflow and out-of-hours enquiries | Abandonment by channel and hour | Segment by channel and business hours to confirm coverage gaps have closed |
| Escalation rate | Hands off with context | Time to handoff and appropriateness of each handoff | Check that handoff summaries arrive and are complete |
| Lead conversion | Collects details and qualifies the prospect | Leads per 100 chats and bookings completed | Match lead records against completed bookings in your CRM |
| CSAT and answer quality | Transcripts you can audit | Verified-answer rate and misunderstood-intent rate | Audit a sample by language and channel each month |
An AI front desk that answers from your uploaded knowledge can lift FCR on routine questions. An instant substantive reply lowers first response time. Out-of-hours coverage catches enquiries that would have been abandoned. A summary on handoff shortens the escalation and stops the customer repeating themselves. Qualified leads, with details already collected, are what conversion can use.
Our front desk answers from your business information, collects the customer's details, and sends the team a summary. It asks the qualifying questions and hands over a lead that is ready to call. You can read past conversations and check exactly what was said. That read is the control. The bot only raises a number when the answer matches the source material. A deeper scorecard for automation sits in how to measure AI chatbot KPIs.
Quality checks most dashboards skip
Containment is not success when the answer is fast but wrong, incomplete, unsupported, or unsafe. Track verified-answer rate, misunderstood-intent rate, correction rate, whether the human escalation was appropriate, unresolved-after-escalation rate, language-specific CSAT, and how often the customer had to explain the issue twice. Audit those by language, accessibility need, channel, and segment. An aggregate average will hide a language the bot keeps missing.
The same discipline applies to the knowledge behind the bot. Teams that care about maintaining reliable franchise knowledge treat the source documents as the product, not a one-time upload. If the catalog, the SLA, or the price sheet is stale, every green KPI downstream is borrowed time.
Hyperleap AI is an AI front desk that answers from your own knowledge, collects the details your team needs, and books the next step across your site and messaging channels (natively with Calendly or Cal.com on Pro and Max; on Plus it shares your booking link). If you want kpi customer care tied to resolved conversations rather than reply speed, start with your catalog and your real handoff rules. Visit Hyperleap AI and put a baseline on the conversations you already have.