Guide
Customer Service Metrics: 13 Defined, 6 to Start With
The customer service metrics that matter for a small business: definitions, formulas, what to track, what to skip, and a simple weekly scorecard.

Gopi Krishna Lakkepuram · Founder & CEO
· 19 min read
TL;DR
- Customer service metrics fall into four groups: speed, quality, load, and revenue. A small business needs about six of them, not thirty.
- Start with first response time, first contact resolution, CSAT, backlog, contact rate, and lead conversion from conversations. Add the rest when your volume or team grows.
- Every metric below has a plain formula. You can compute all of them from your inbox and one spreadsheet, then review them once a week.
The customer service metrics worth tracking are the ones that tell you three things: how fast customers get an answer, whether the answer solved the problem, and what the work costs you. Everything else is decoration. This guide covers 13 metrics, gives the formula for each, says which ones a small business should track now, and ends with a weekly scorecard you can copy.
This post covers customer service as a whole: humans, chat, email, and messaging. If you only want the numbers for an AI chat agent, read AI chatbot KPIs and how to measure success. The two overlap on a few metrics, but the questions differ.
The 13 customer service metrics, grouped
Think of the metrics in four groups. Each group answers a different question, and a healthy weekly review touches all four.
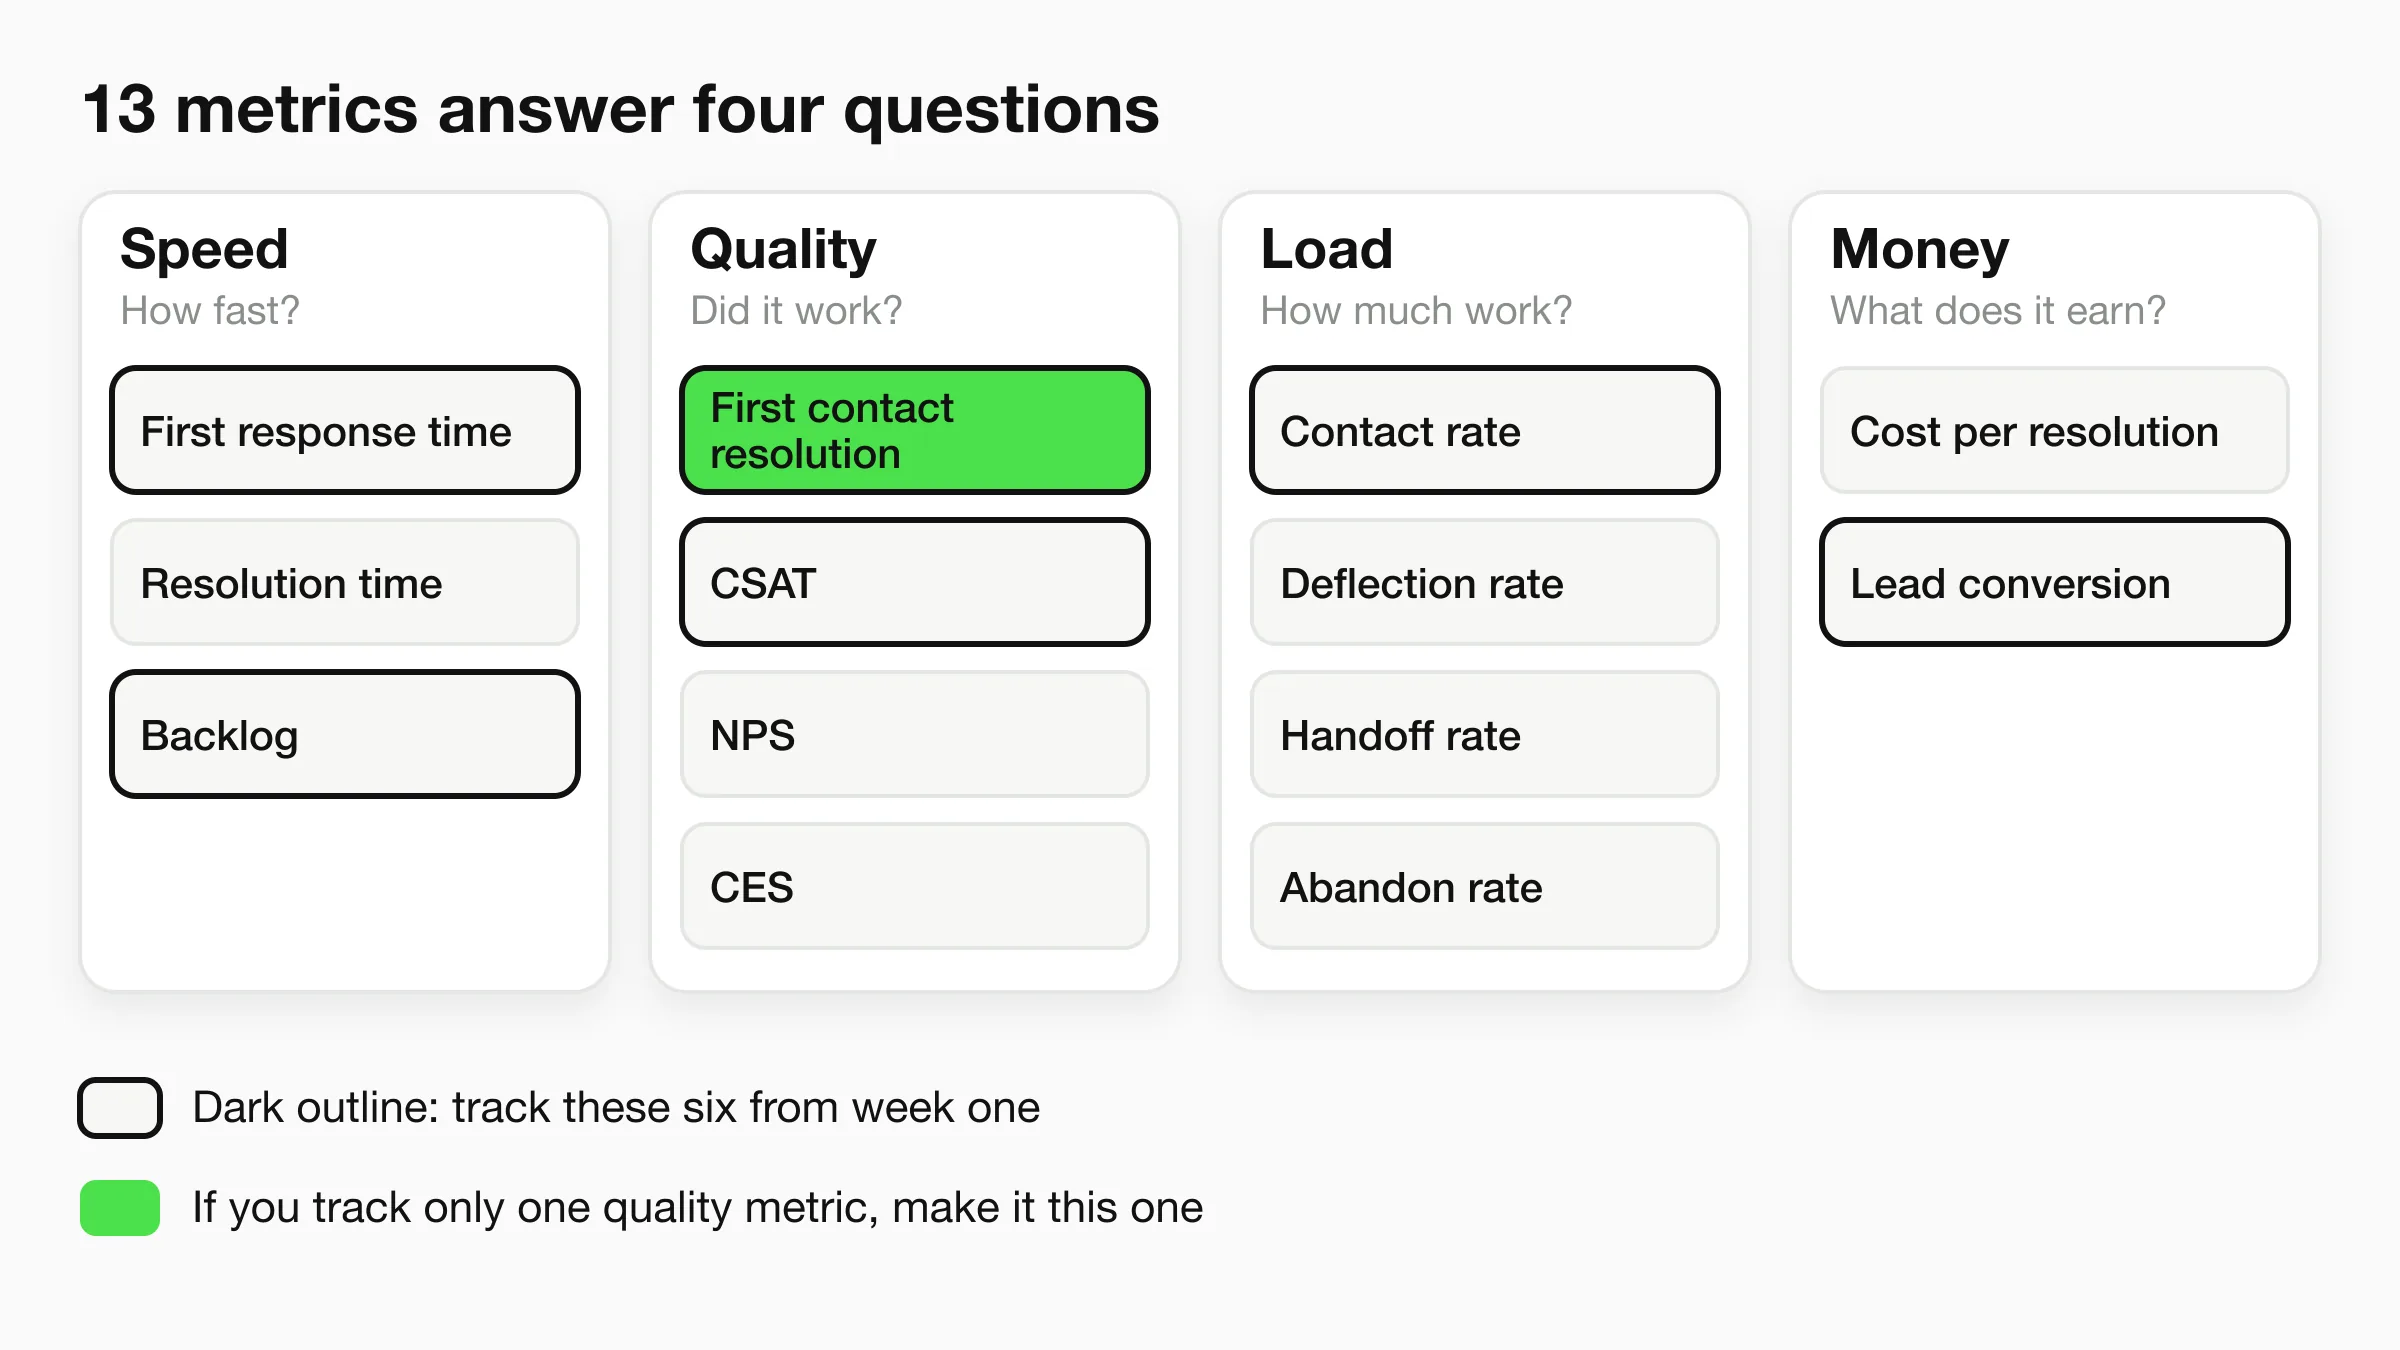
| Group | Question it answers | Metrics |
|---|---|---|
| Speed | How fast do customers get help? | First response time, resolution time, backlog |
| Quality | Did it work, and how did it feel? | First contact resolution, CSAT, NPS, CES |
| Load | How much work comes in, and where does it go? | Contact rate, deflection rate, handoff rate, abandon rate |
| Money | What does it cost, and what does it earn? | Cost per resolved conversation, lead conversion from conversations |
One rule before the definitions: pick a definition and freeze it. If "resolved" means something different in March than in February, your trend line means nothing.
Speed metrics
1. First response time (FRT)
First response time is how long a customer waits for the first reply that is not an automatic acknowledgment.
Formula: first response time = time of first real reply − time the customer's message arrived. Report the median, not the average, because one message that sat over a weekend drags an average up.
Track it. It is the cheapest metric to collect and the one customers feel first. Measure it in business hours and in calendar hours, because a customer who writes at 9pm lives on calendar time.
The research on lead response is consistent in direction. In a Harvard Business Review study of online sales leads, Oldroyd, McElheran and Elkington concluded that most companies are not responding nearly fast enough. For a business that sells appointments or quotes, FRT is a revenue metric, not only a service metric.
If an AI agent answers first, FRT drops to seconds for the questions it can answer. That changes what you should measure: track the first response time for conversations that go to a person, since that is the wait that still exists.
2. Resolution time
Resolution time is how long it takes from the first message until the customer's problem is solved.
Formula: resolution time = time the conversation was marked resolved − time the first message arrived. Again, use the median, and report it by conversation type (billing, booking, product question), because one blended number hides the slow category.
Track it once you have more than a handful of conversations a week. Watch for the long tail: a few conversations that take days usually point to a single broken process, such as a refund that needs the owner's approval.
3. Backlog
Backlog is the number of conversations waiting on you right now, ideally split by age.
Formula: backlog = open conversations at a point in time. Add an age split: count how many are older than 24 hours and older than 72 hours.
Track it. It takes ten seconds to read and is the earliest warning that you are falling behind.
Quality metrics
4. First contact resolution (FCR)
First contact resolution is the share of issues solved in the first conversation, without the customer coming back about the same thing.
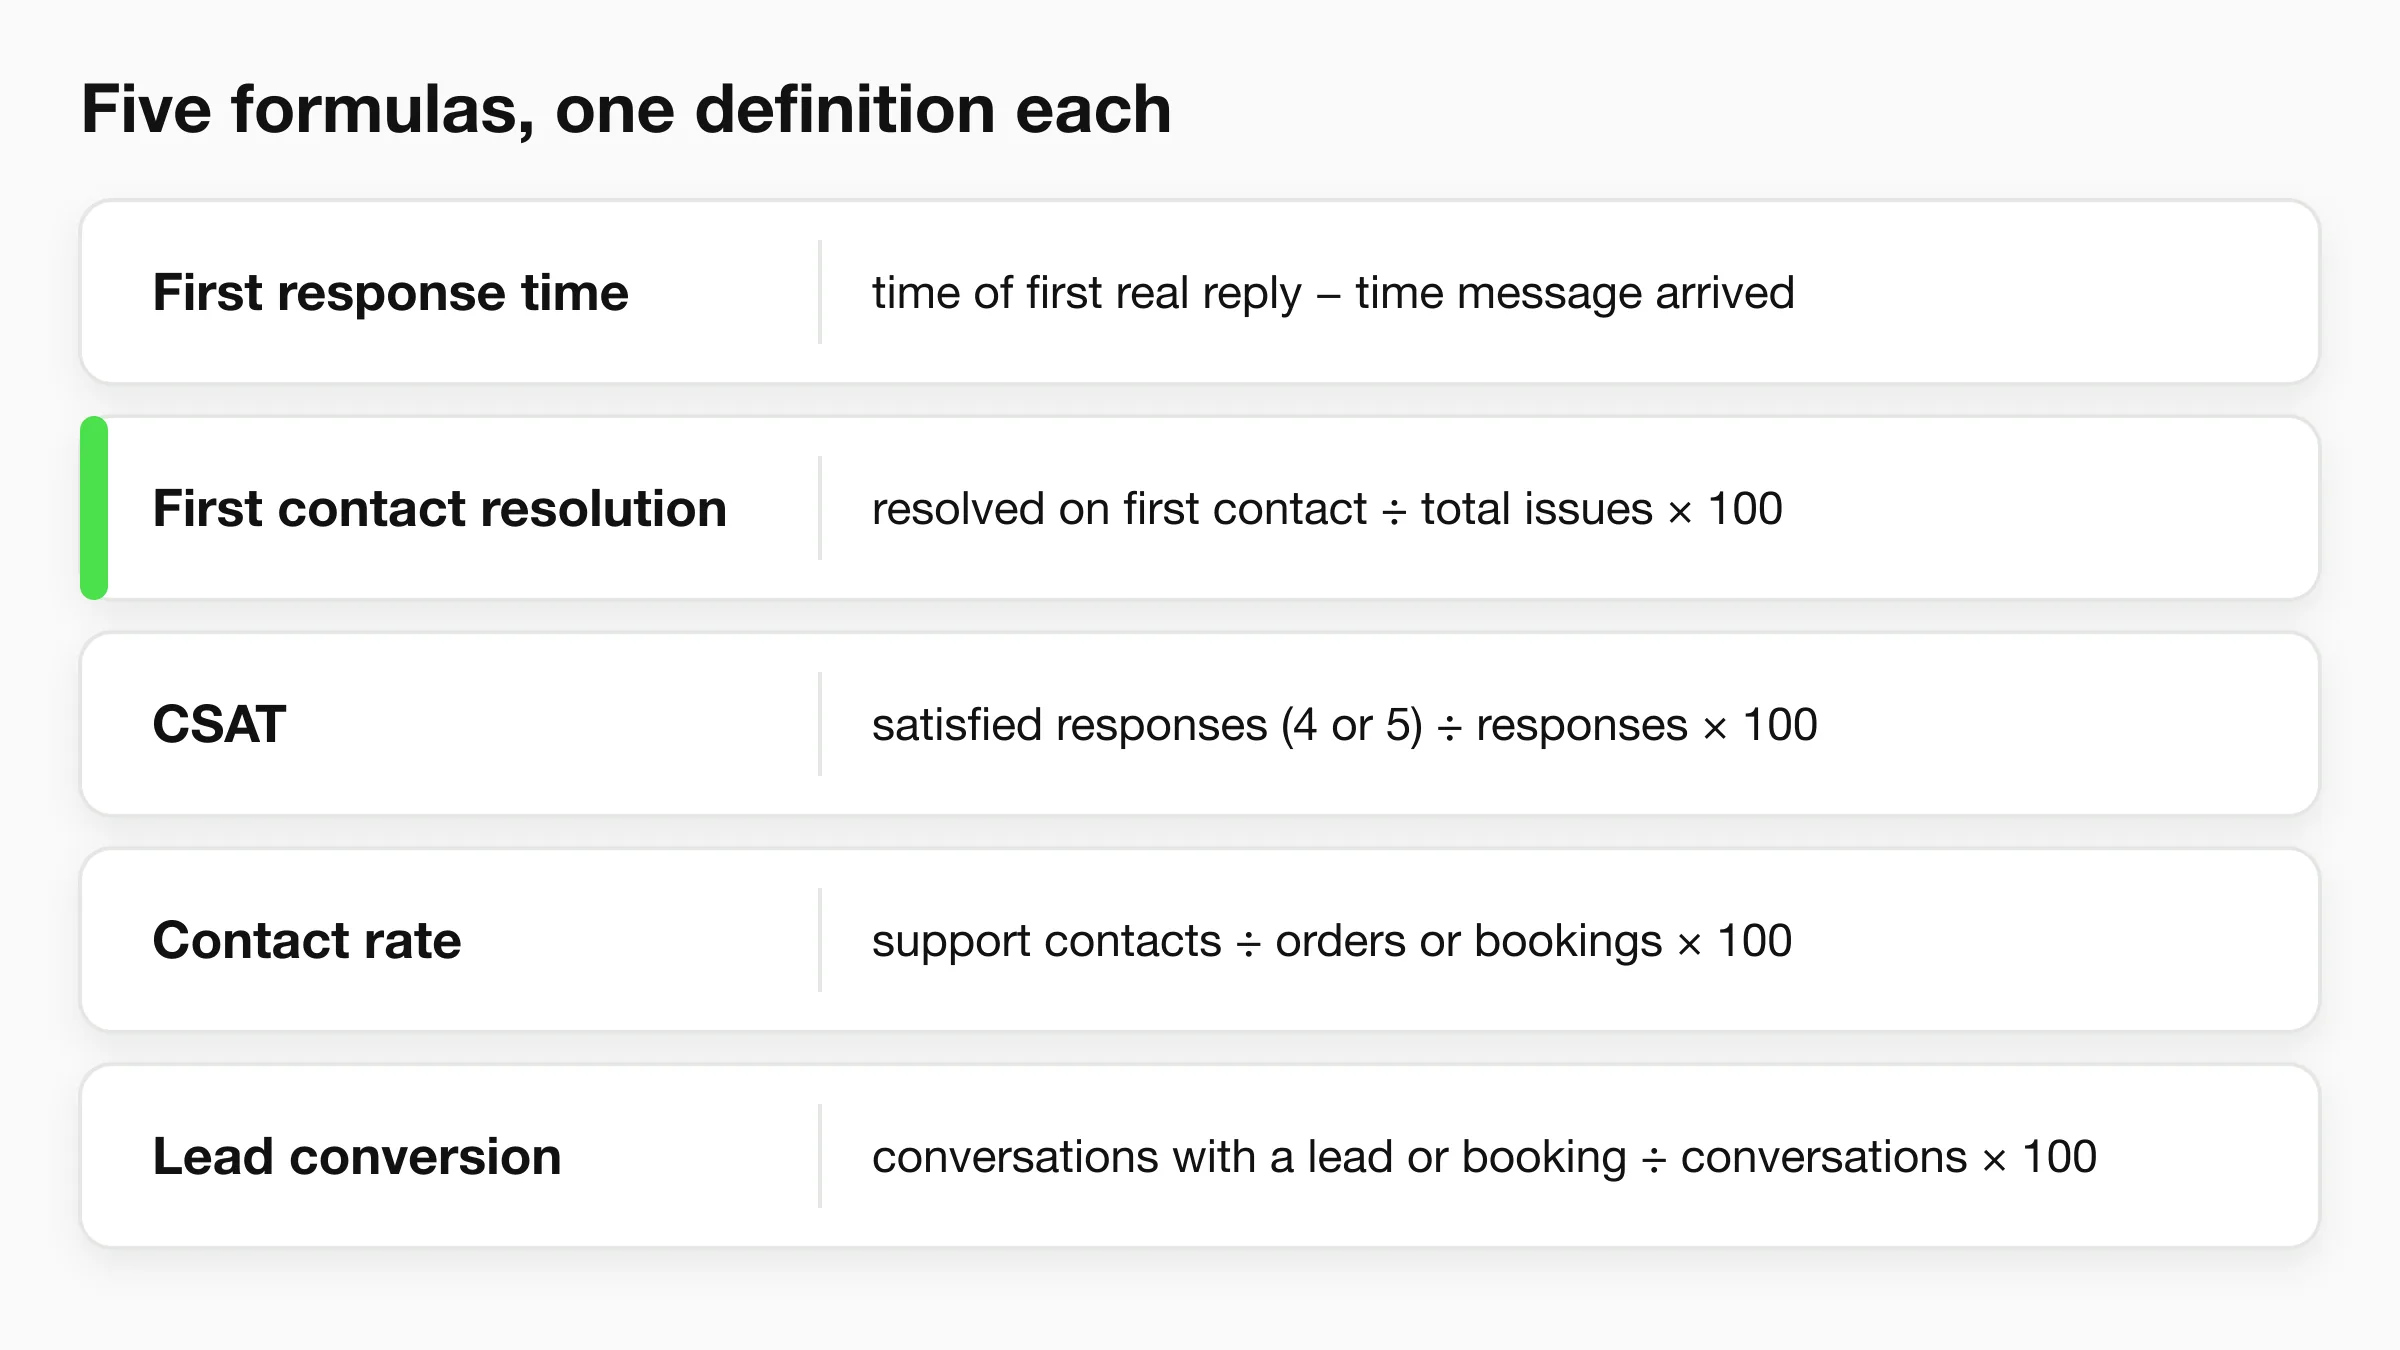
Formula: FCR = issues resolved in the first conversation ÷ total issues × 100. Count an issue as "not resolved first time" if the same customer contacts you again about it within a set window, such as seven days.
Track it. If you only track one quality metric, make it this one. Repeat contacts are the most expensive kind of work, and they are the clearest sign that an answer was incomplete. In the Harvard Business Review article Stop Trying to Delight Your Customers, the authors argue that reducing repeat contacts matters more for loyalty than going above and beyond.
5. Customer satisfaction score (CSAT)
CSAT is the share of customers who say they were satisfied with a specific interaction.
Formula: CSAT = satisfied responses ÷ total responses × 100. "Satisfied" usually means a 4 or 5 on a five-point scale. Ask one question right after the conversation: "How satisfied were you with this answer?"
Track it, but read it with its response rate. If 5% of customers answer, your CSAT describes the 5% who felt strongly. Keep the survey to one tap, and read the written comments on every low score. The comments are where the fixes are. For the fixes themselves, see how to improve customer satisfaction.
6. Net Promoter Score (NPS)
NPS measures how likely customers are to recommend your business, not how they felt about one conversation.
Formula: NPS = % promoters − % detractors. Customers answer "How likely are you to recommend us to a friend or colleague?" on a 0 to 10 scale. Promoters score 9 or 10, passives 7 or 8, detractors 0 to 6. This is the Net Promoter System definition.
Track it later. NPS is a relationship metric. It reflects price, product, and brand as much as support. Run it once a quarter by email to your existing customers, not after every chat. For a business with under a few hundred customers, the score swings too much to act on.
7. Customer effort score (CES)
CES measures how hard the customer had to work to get their issue handled.
Formula: CES = average rating of "How easy was it to get your issue resolved?" on a 1 to 7 scale, or the percentage who agree that it was easy. The idea comes from the same Harvard Business Review article, which argued that effort predicts loyalty better than delight does. Treat that as one influential argument, not settled science, since later commentators have questioned how the claim was tested.
Track it later. CES is useful when you are redesigning a process, such as returns or booking changes. Send it for that one process and compare before and after. As an always-on metric, it adds a second survey without adding much beyond CSAT and FCR.
Load metrics
8. Contact rate
Contact rate is how often customers need to contact you, relative to how much business you do.
Formula: contact rate = support contacts ÷ orders (or bookings, or active customers) × 100. Use the denominator that fits your business: orders for a store, appointments for a clinic, active jobs for a home services company.
Track it. This is the metric most small businesses skip, and it is the most useful one for finding fixes. Raw ticket volume rises when you grow, which is good news. A rising contact rate means something in your product, website, or process is confusing people. A falling one means a fix worked.
9. Deflection rate (self-service rate)
Deflection rate is the share of questions answered without a person getting involved.
Formula: deflection rate = conversations resolved without a human ÷ total conversations × 100. The hard part is the word "resolved": a customer who gave up is not a deflected customer. Our guide to ticket deflection covers how to measure it honestly, including how to tell a real answer from an abandoned chat.
Track it if you use a chatbot, help center, or any self-service. Pair it with CSAT on those same conversations. High deflection with low satisfaction means customers are being walled off, not helped.
10. Handoff rate
Handoff rate (also called escalation rate) is the share of automated conversations that end up with a person.
Formula: handoff rate = conversations passed to a human ÷ total automated conversations × 100.
Track it if you use an AI agent. It has no universal "good" number. A clinic that routes every urgent or sensitive question to staff should see a healthy handoff rate. What matters is the reasons. Read ten handed-off conversations a week and sort them: missing knowledge (fixable), sensitive topic (correct), or customer asked for a person (correct).
11. Abandon rate
Abandon rate is the share of conversations the customer started and then left before getting an answer or finishing.
Formula: abandon rate = conversations where the customer left without resolution ÷ total conversations × 100.
Track it. It catches the silent failures that CSAT never sees, because people who walk away do not fill in surveys. Look at where they leave: after a long wait, after a vague answer, or after being asked for contact details too early.
Money metrics
12. Cost per resolved conversation
Cost per resolved conversation is what it costs you to close one conversation.
Formula: cost per resolved conversation = total support cost in the period ÷ conversations resolved. Include staff time (hours × loaded hourly cost), software, and any outsourced help.
Track it later, quarterly. Weekly it is noisy. It becomes useful when you are deciding whether to hire, outsource, or automate part of the work. For a worked method, see our AI chatbot ROI framework.
13. Lead conversion from conversations
Lead conversion from conversations is the share of conversations that turn into a lead, a booking, or a sale.
Formula: lead conversion = conversations that produced a lead or booking ÷ total conversations × 100. Define "lead" once: a name plus a way to reach them, for example.
Track it if customers ask you pre-sale questions, which for most service businesses they do. A dental clinic's chat is a front desk. A home services company's inbox is mostly quote requests. Treat those conversations as revenue conversations and measure them that way. Split by channel and by source when you can, because a website visitor and a WhatsApp enquiry rarely convert at the same rate.
Which metrics to track, and which to skip
You do not need all 13 on day one. Here is a sensible order for a small business.
| Metric | Track now | Add later | Skip for now |
|---|---|---|---|
| First response time | Yes | ||
| First contact resolution | Yes | ||
| CSAT | Yes | ||
| Backlog | Yes | ||
| Contact rate | Yes | ||
| Lead conversion from conversations | Yes | ||
| Resolution time | At 20+ conversations a week | ||
| Deflection rate | When you add self-service or AI | ||
| Handoff rate | When you add an AI agent | ||
| Abandon rate | When you add chat | ||
| Cost per resolved conversation | Quarterly, when staffing decisions arise | ||
| NPS | Quarterly, at a few hundred customers | ||
| CES | For one process redesign |
And three things to skip, or at least stop reporting as headlines:
- Total ticket or message volume. It goes up when you grow, so it tells you nothing about service. Use contact rate instead.
- Average handle time as a target. Rewarding short conversations teaches people to rush. Use it only to plan staffing.
- Number of conversations handled per agent. It rewards speed over solving. FCR is the fairer measure.
Benchmarks: use your own first
Published benchmarks differ by industry, channel, and how each company defines the metric, so a figure from another business is a weak target. Run your own numbers for four to six weeks, then aim to beat your baseline. Where we cite outside research in this guide, it is linked at the point of use.
A simple weekly scorecard
A scorecard works when it fits on one page and the same person reads it at the same time each week. This one has six metrics and a note on what to do if each moves the wrong way.
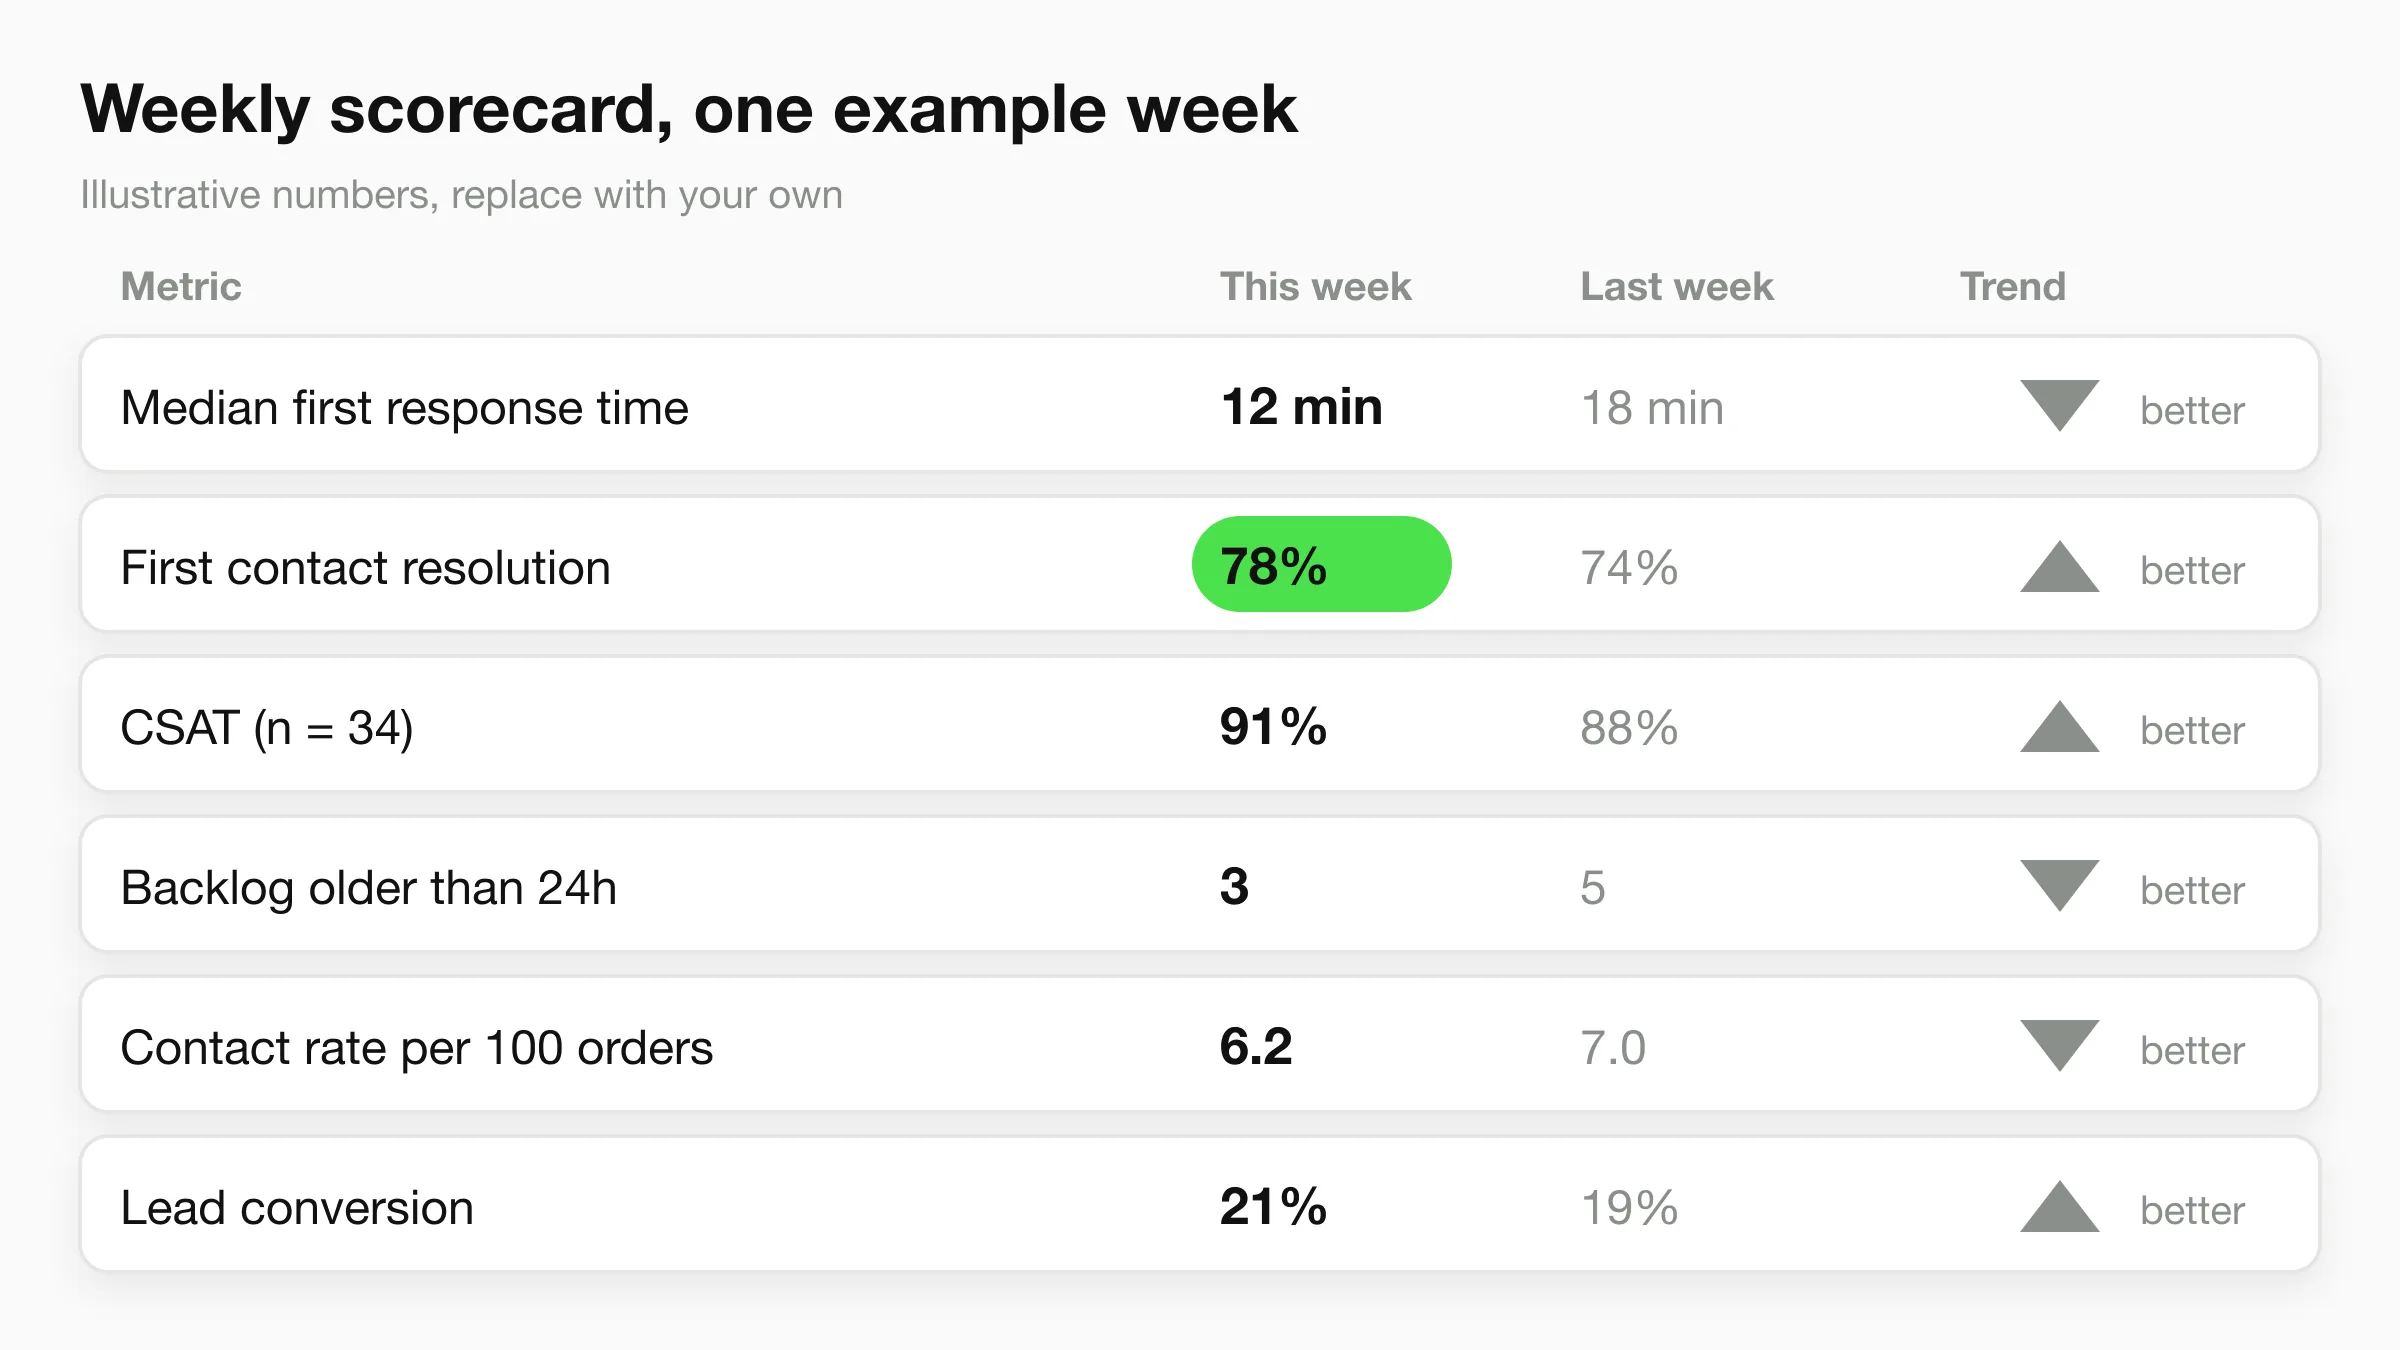
The numbers in the figure are an illustrative example week, not a benchmark. Replace them with your own.
| Metric | This week (example) | Last week (example) | If it gets worse |
|---|---|---|---|
| Median first response time | 12 min | 18 min | Check staffing at peak hours |
| First contact resolution | 78% | 74% | Read the repeat contacts and fix the unclear answer |
| CSAT (with response count) | 91% (n=34) | 88% (n=29) | Read every low score's comment |
| Backlog older than 24h | 3 | 5 | Clear it before taking on new work |
| Contact rate per 100 orders | 6.2 | 7.0 | Find the top reason people contact you and fix its source |
| Lead conversion from conversations | 21% | 19% | Review the conversations that did not convert |
To run it in practice:
- Pick a fixed time. Fifteen minutes, same day each week.
- Pull the numbers from one place. Your inbox or helpdesk export, plus a spreadsheet with a row per week.
- Read 10 conversations. Numbers say something is wrong. Transcripts say what. Include a few low-CSAT ones, a few handoffs, and a few that did not convert.
- Pick one fix. Change one thing, write it next to the week's row, and see whether the number moves.
What you can see in Hyperleap today
If your customers reach you on your website, WhatsApp, Instagram DM, or Facebook Messenger, an AI front desk like Hyperleap covers part of this list and leaves the rest to your inbox and spreadsheet. Here is what exists, stated plainly.
The analytics page. Hyperleap's chatbot analytics shows unique users, conversations, total messages, abandon rate, average and longest conversation duration, messages per conversation, countries, and daily and peak-hour activity, across all four channels, filterable by date range and timezone. That covers abandon rate directly and gives you volume and busy hours for staffing. It gives you the denominators for contact rate and conversion.
Conversation logs. Every conversation sits in a unified inbox. The log shows which of your attached sources an answer drew on, so when an answer is wrong you can see which page or document to fix. This is a log feature for your team, not citations shown to customers in the chat. Reading these is how you do the "read 10 conversations" step above.
Leads. Captured leads sit alongside their conversations and can be downloaded as CSV or Excel. That is the raw material for lead conversion from conversations: count the conversations, count the leads, divide. The website chat can collect contact details with a short form. On WhatsApp, Instagram DM and Messenger, the contact comes from the platform.
Where conversations come from. On Pro and Max, link tracking shows which source or campaign started each conversation and which links the agent shared were clicked. That lets you split lead conversion by source instead of treating every conversation alike.
Human handoff. On Pro and Max, visitors can ask for a person, your team is alerted in Studio, and any teammate can take over the live conversation and hand it back. Count the conversations a teammate took over each week and you have your handoff rate. For first response time on those conversations, note the time of the handoff request and the time of the first human reply.
Ask Claude or ChatGPT about your leads. Hyperleap's MCP server is included on every paid plan. You connect Claude, ChatGPT, or another compatible assistant with one sign-in, then ask in plain English: "Which leads came in from WhatsApp this week?" or "What has this lead asked us about so far?" It reads your leads and conversations. It cannot send messages or change settings. Its one write is that, when you ask it to extract insights from a lead, it saves them to that lead's profile. It is a quick way to prepare the weekly review, though you should still read the transcripts yourself.
What it does not do. The analytics page does not compute CSAT, NPS, CES, resolution time, backlog, or cost per resolved conversation. Collect those from your own survey tool and spreadsheet. Webhooks (Pro and Max) and the REST API can send conversation and lead data to a sheet or tool you already use if you want to automate that. Plans start at $40/month for Plus; see pricing for what each plan includes.
See your conversations and leads in one place
Hyperleap AI answers on your website, WhatsApp, Instagram DM, and Facebook Messenger, and logs every conversation. Plans from $40/month, 7-day free trial.
Start for freeExamples by business type
Different businesses should weight the same list differently.
Dental clinic. Most messages are appointment requests, hours, insurance questions, and rescheduling. Lead conversion from conversations (new patient enquiries that become bookings) and first response time matter most. Handoff rate matters for sensitive questions, which an agent should route to staff, not answer. See AI agents for dental practices.
Home services company. Customers write with a photo and "how much to fix this?" Backlog and first response time decide who gets the job, since the customer is messaging several companies. Lead conversion by source tells you which ads and listings bring real quote requests. See AI agents for home services.
Online store. Contact rate per 100 orders is the metric to watch. Most contacts are "where is my order?", returns, and sizing. If contact rate rises after a carrier change or a product launch, you have found the cause without a survey. Deflection matters here once an agent answers the order and policy questions.
Common mistakes with customer service metrics
- Mixing definitions. If "resolved" means "closed" one month and "customer confirmed" the next, your trend is fiction.
- Averages that hide the tail. Use medians and show the slowest 10%.
- Rewarding the metric instead of the outcome. Targets on handle time or tickets closed make people close tickets, not solve problems.
- Ignoring the conversations that never reach you. Abandon rate and contact rate cover the customers who gave up or never asked.
- Measuring AI answers by deflection alone. Check satisfaction and repeat contacts on the same conversations. Our customer service automation stats guide covers what published research says about automation, and where to be careful with it.
If you are also working out when to hand customers to an AI agent in the first place, the 24/7 customer support guide for small businesses walks through the options, and conversational AI for customer service covers what an agent handles well.
Frequently Asked Questions
What are the most important customer service metrics?
For most small businesses, six: first response time, first contact resolution, CSAT, backlog, contact rate, and lead conversion from conversations. They cover speed, quality, load, and revenue. Add resolution time, deflection, handoff, abandon rate, NPS, CES, and cost per resolved conversation as volume and team size grow.
How do you measure customer service?
Pick a short list of metrics, define each once, and pull them from your inbox or helpdesk every week into a spreadsheet. Pair the numbers with a weekly read of about ten real conversations. Add a one-question survey for CSAT right after the conversation ends.
What is the difference between CSAT, NPS, and CES?
CSAT scores one interaction ("How satisfied were you with this answer?"). NPS scores the relationship ("How likely are you to recommend us?"). CES scores the effort ("How easy was it to get this resolved?"). Use CSAT weekly, NPS quarterly, and CES when you redesign a specific process.
What is a good first response time?
It depends on your channel and customer expectations, and published figures vary by how each company defines the metric. Measure your own median for four to six weeks, then set a target you can beat. Customers who message at night or by WhatsApp generally expect faster replies than customers who send an email.
Can an AI agent help with customer service metrics?
It can change several of them: first response time drops for questions it answers, deflection and handoff rate become measurable, and every conversation is logged for review. It does not replace the need to measure quality. Keep CSAT and repeat contacts in your review, and read a sample of conversations weekly.
Where do I find customer service metrics in Hyperleap?
The analytics page shows conversations, messages, abandon rate, duration, peak hours, and visitors. The inbox and conversation logs show the detail, leads can be exported as CSV or Excel, and link tracking on Pro and Max shows the source of each conversation. CSAT, resolution time, and backlog are tracked in your own sheet.
Put a front desk on your inbox
Answer customer questions on every channel, capture leads, and review every conversation. Start with a 7-day free trial.
Start for freeIndustry Solutions
See how AI chatbots work for these industries:
Related Articles
View all
Guide13 min read
Customer Support vs Customer Service: The Difference
Customer service helps people through the whole buying relationship. Customer support fixes problems with what they bought. Here is how to run both.
Guide18 min read
Customer Self-Service: Options, Examples and Setup
Customer self-service explained for small businesses: seven options compared by cost and effort, how to pick what to automate, and how to measure it.
Guide19 min read
Customer Service Skills: 14 That Matter, With Examples
The 14 customer service skills a small business needs, each with a plain definition, a weak vs better reply, and a way to train it in a small team.
Guide13 min read
Customer Success vs Customer Support: The Real Difference
Customer success vs customer support: support fixes problems when asked, success prevents them. Compare goals and metrics, and see how small teams do both.